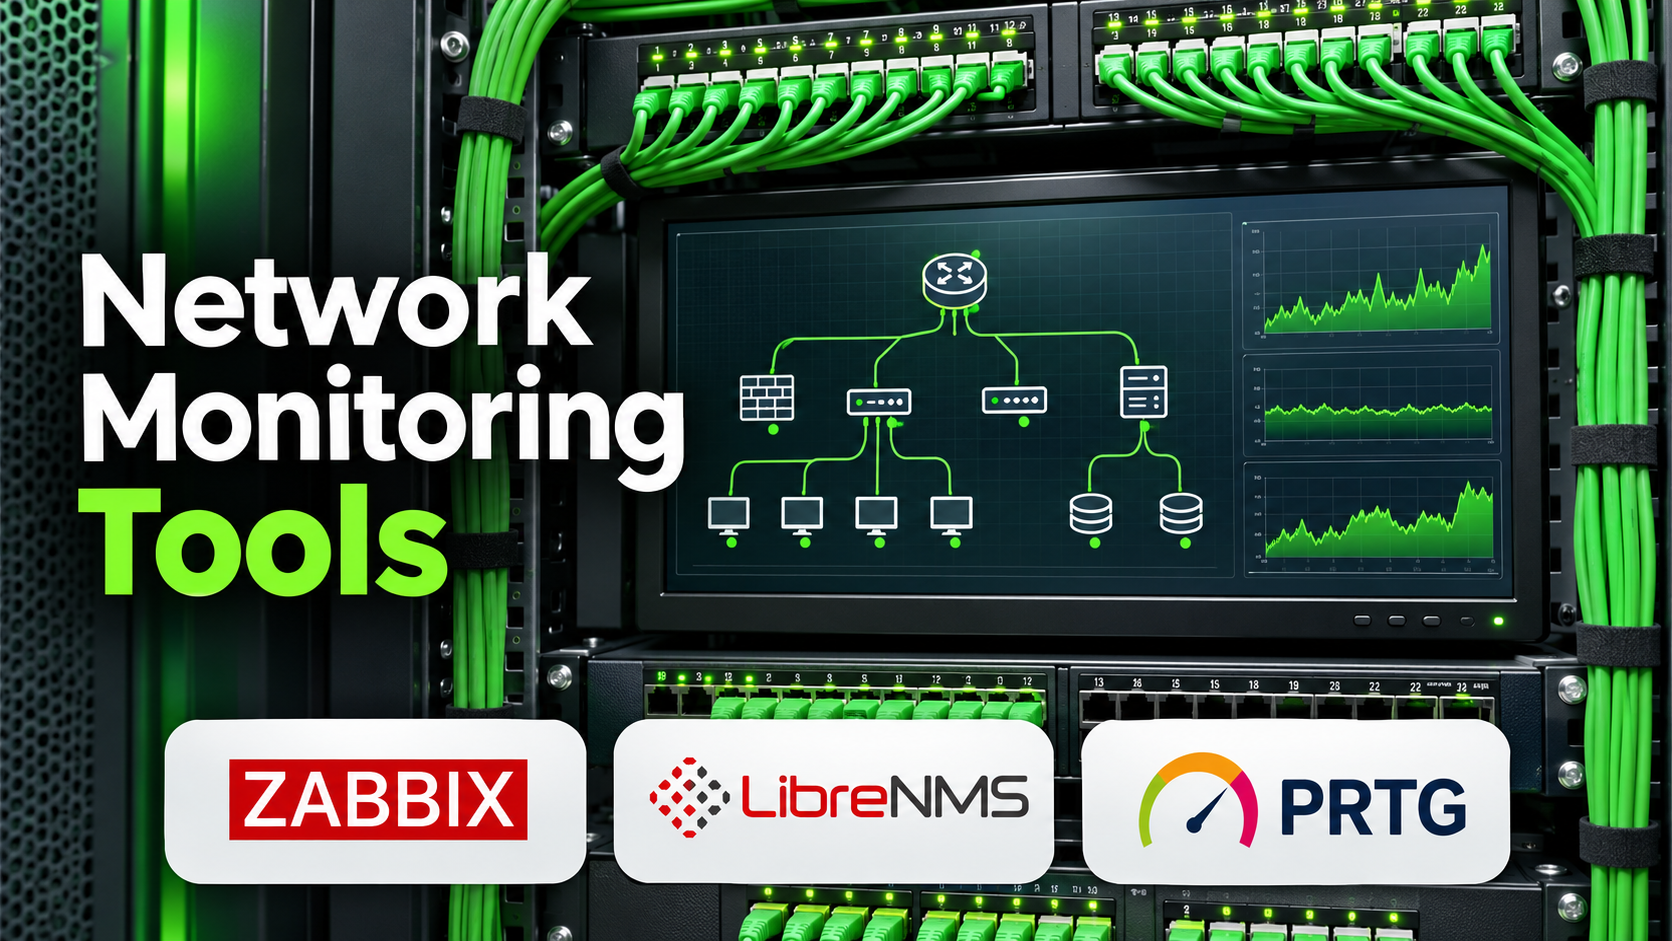
When a branch office loses its upstream connection, dozens of devices can disappear from the monitoring console at once. The useful alert identifies the path that failed and the services it affected. Getting there takes representative measurements, accurate device relationships, and enough visibility to tell a broken network from a broken collector.
Combine signals according to the question
SNMP polling can show interface counters and device health. Flow telemetry helps explain who is using bandwidth. Active probes measure reachability, loss, or latency from a defined location. A link that responds to a ping may still drop traffic under load, and a busy interface says little about which application is responsible without additional context.
Compare tools using the equipment you operate
| Tool | Where it fits | What to verify |
|---|---|---|
| Zabbix | Teams monitoring infrastructure and network devices together | Coverage of SNMP data and templates across your hardware |
| LibreNMS | Network-focused teams that value discovery and broad device visibility | Vendor-specific interfaces, discovery boundaries, and polling scale |
| PRTG | Teams evaluating packaged monitoring with configurable sensors | Sensor counts, remote probe placement, and support for required data types |
Simulate loss of the link and loss of the collector
In a controlled test, disable an upstream link and check whether the alert identifies the affected site without paging separately for every dependent device. Then stop a collector and confirm that missing measurements are surfaced as a monitoring problem. Run the same tests across remote sites where the monitoring path can fail independently of user traffic.
Before expanding, confirm who maintains device credentials, templates, and the relationship map. The alerts stay useful only if that inventory follows the network as it changes.