A branch office reports that its inventory application takes 20 seconds to load. The WAN dashboard shows normal utilization, and the server team sees no increase in errors. Both observations can be true. A slow DNS response, a stalled connection, or a problem at an intermediary may affect a small number of sessions without making a dent in an aggregate dashboard.
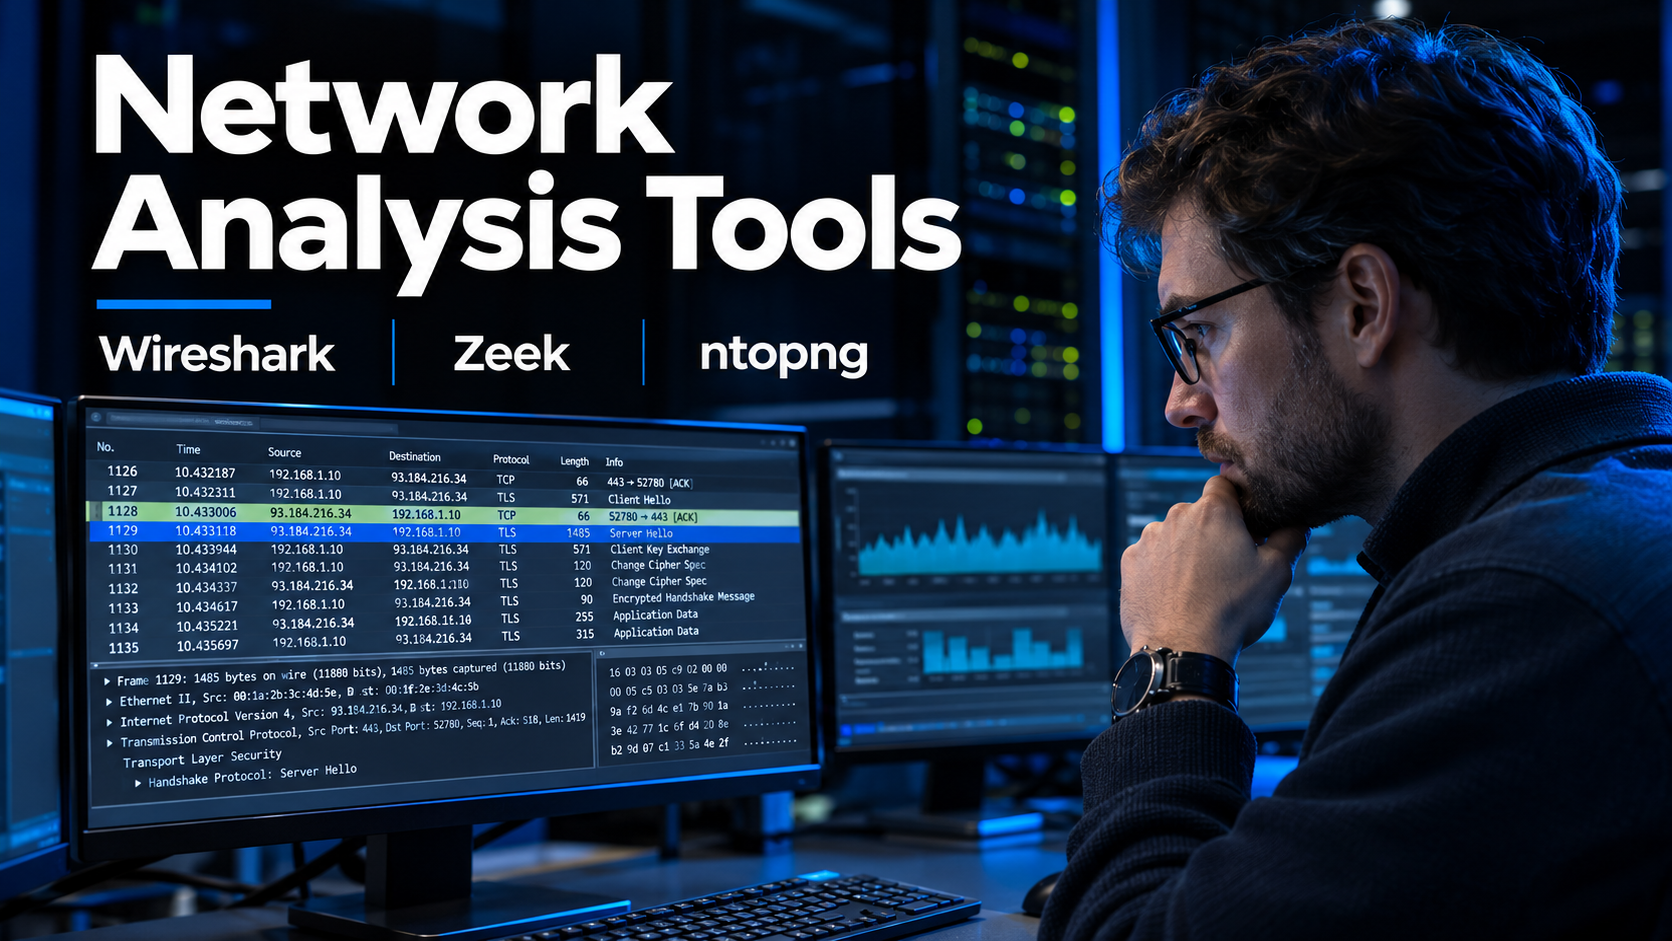
Network analysis tools help narrow that gap. The choice starts with the evidence you need. Traffic flows show which systems communicated and how much data moved. Protocol logs record selected events in a form you can search. Packet captures preserve the timing and headers seen at a particular point on the network, along with any payload bytes that were captured.
Follow the incident from broad to narrow
Start with the affected user, destination, and time window. A flow view can show whether the expected connection was active, whether one host dominated the link, and whether the issue appears confined to one site. Flow records depend on where they were observed and whether the exporter sampled traffic, so treat a missing flow as a lead to investigate.
Next, look for an event that separates plausible causes. DNS logs may show repeated failed lookups. Connection logs may show sessions that ended early. If those records narrow the problem to a specific exchange, capture traffic at a point where you can observe the relevant direction or, ideally, both directions.
A retransmission visible in a client-side trace can help identify when an exchange stalled. A second capture on the far side of a suspected hop can help localize what happened between the two points. Align the clocks and account for dropped capture packets before drawing conclusions. With encrypted traffic, timing and connection behavior may still be visible while application content remains protected.
Three tools for three kinds of evidence
| Tool | Where it helps | What to verify |
|---|---|---|
| Wireshark | Inspect a specific packet sequence or protocol field in a live capture or saved trace. | Whether you can capture at the right point with acceptable packet loss. A display filter changes the view after capture. |
| Zeek | Search structured records of connections and observed protocol activity over time. | Whether the sensor sees the relevant traffic and retains the logs needed for investigations. |
| ntopng | Explore traffic conversations, active hosts, and bandwidth patterns from supported traffic inputs. | Whether the intended exporters, sampling settings, and retention support the level of detail you need. |
The Wireshark User’s Guide explains capture and display filtering. The Zeek connection-log reference shows how to interpret the fields available for correlation, and the ntopng flow documentation describes the information available in its flow view.
Measure whether the evidence changes the next step
Replay a closed incident with a known cause. Give the operator the information available when the ticket first arrived. Record which evidence helped them choose the next diagnostic step, how long it took to find, and which parts of the traffic path they could observe.
Plan retention around that exercise. Flows and protocol logs can provide a longer investigation window, while packet captures can contain sensitive data and are generally more expensive to store. A targeted capture at the right point may answer more than days of traffic collected in the wrong place. Use the pilot to decide where to collect each type of evidence and who should be able to retrieve it.