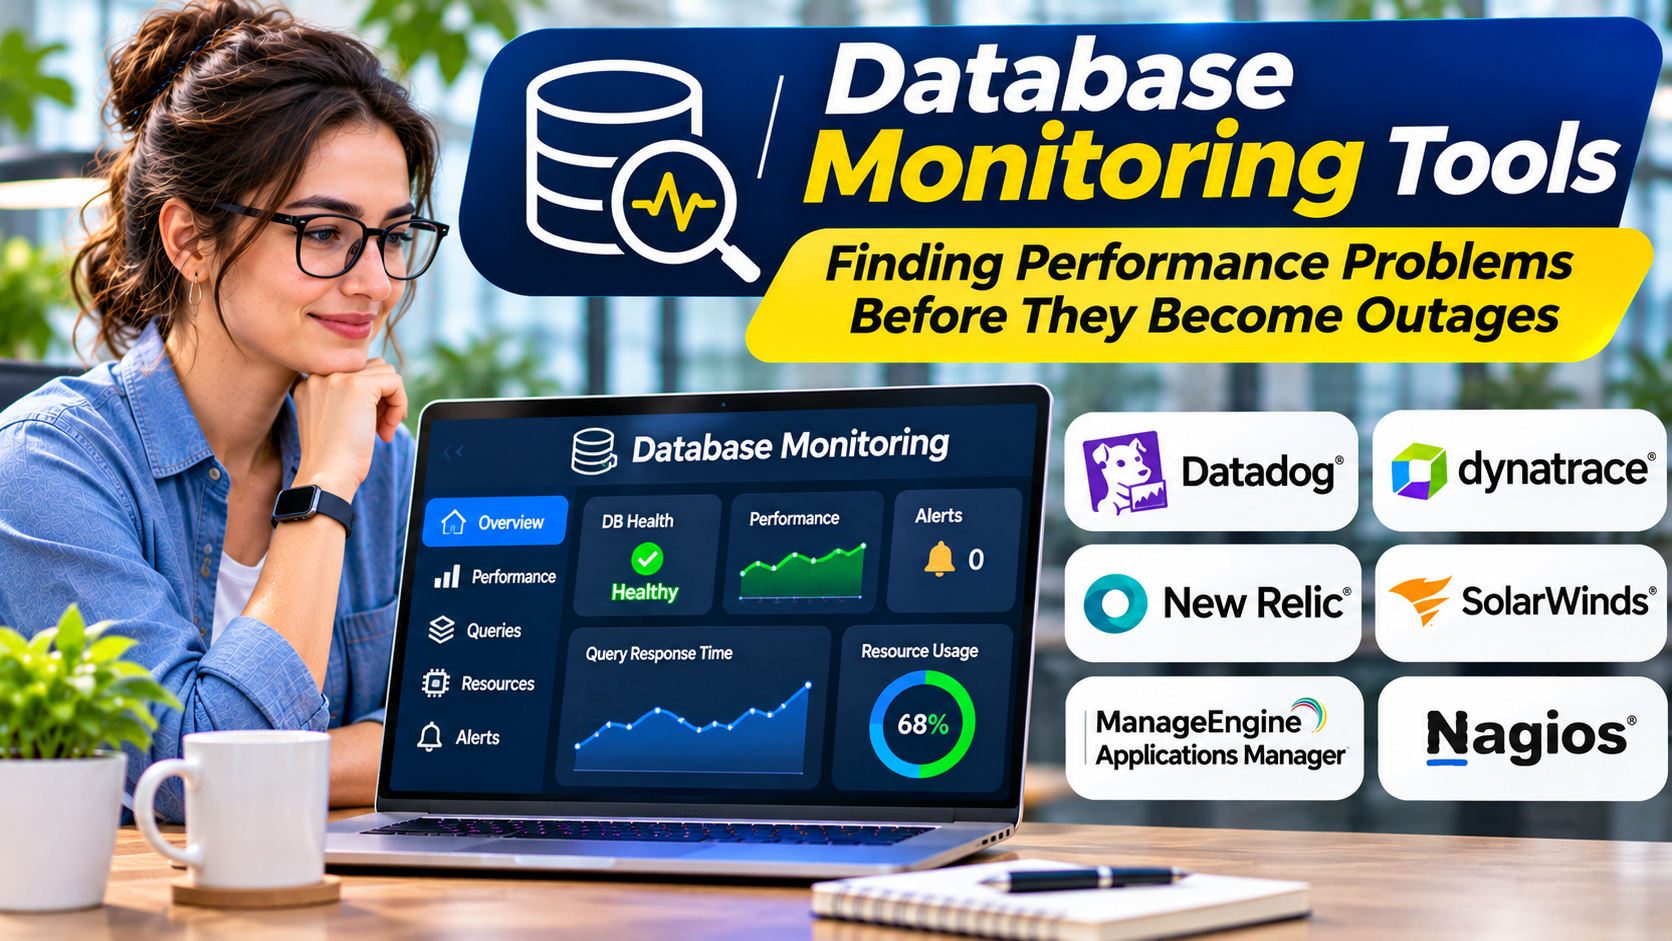
A database does not need to crash to create a serious business problem.
An online store may remain available while checkout transactions become painfully slow. A reporting application may display outdated information because replication has fallen behind. A customer service platform may appear healthy until one expensive query begins blocking hundreds of other requests.
These problems often develop before a database becomes completely unavailable.
Database monitoring tools help administrators, developers, and infrastructure teams recognize warning signs, investigate performance bottlenecks, and understand how database behavior affects applications.
However, collecting more metrics does not automatically produce better reliability.
The real value comes from connecting technical measurements to meaningful operational decisions.
What Are Database Monitoring Tools?
Database monitoring tools are software platforms that collect, analyze, and display information about database health, performance, availability, and resource usage.
They help teams answer questions such as:
- Is the database responding normally?
- Which queries consume the most resources?
- Are applications waiting for locks or connections?
- Is replication operating correctly?
- Are storage or memory limits approaching?
- Did performance change after a deployment?
- Which database issue is affecting application users?
Some monitoring tools specialize in database internals.
Others are broader observability platforms that combine database metrics with application traces, infrastructure telemetry, and logs.
The appropriate approach depends on how the organization operates its databases.
Why Database Uptime Is Not Enough
Traditional availability monitoring may confirm that a database server responds to a connection attempt.
That is useful, but it provides an incomplete picture.
A database can accept connections while important transactions take several seconds longer than expected.
It may also process ordinary queries successfully while one reporting workload creates resource contention.
Database monitoring must therefore consider both availability and performance.
For example, imagine a retail application where checkout queries normally complete quickly.
After a software deployment, a frequently executed query begins scanning a large table.
The database remains online, but checkout requests become slower as traffic increases.
A useful monitoring platform should help identify the expensive query, show when the change occurred, and provide evidence that supports investigation.
Simply reporting that CPU utilization increased is not enough.
The Database Metrics That Matter Most
Query Latency
Query latency measures how long database operations take to complete.
Monitoring averages can help identify broad trends, but averages may hide unusually slow requests.
Percentile measurements and query-level analysis can reveal performance problems affecting a subset of users.
Query Throughput
Throughput describes how many operations a database processes during a given period.
Increasing throughput may indicate business growth or changing application behavior.
A sudden decline may signal application failures, resource contention, or other operational problems.
Throughput should always be interpreted alongside latency and error rates.
Connection Usage
Applications connect to databases through sessions or connection pools.
When connection limits are reached, new requests may wait or fail.
Monitoring active, idle, and waiting connections can reveal connection leaks, inefficient pooling, or unexpected traffic.
Locking and Blocking
Databases use locks and other concurrency controls to protect transaction consistency.
Long-running transactions can block other operations.
Monitoring blocking sessions and lock waits helps administrators distinguish concurrency problems from hardware shortages.
CPU and Memory Usage
CPU and memory metrics provide important infrastructure context.
However, high utilization does not always mean a database is unhealthy.
A database may intentionally use available memory for caching.
Administrators need to interpret these measurements alongside query behavior, wait events, and application performance.
Storage Capacity and I/O
Database performance depends on storage capacity, throughput, and latency.
Monitoring should identify storage growth, unusually slow I/O, and capacity constraints.
Running out of storage can also threaten database availability.
Replication Lag
Replicated databases may experience delays between primary and secondary systems.
Lag can affect reporting accuracy, read consistency, and recovery expectations.
Monitoring should distinguish ordinary replication behavior from delays that threaten business requirements.
Database Monitoring Tools Worth Evaluating
Different monitoring products provide different levels of database specialization.
Datadog Database Monitoring
Datadog Database Monitoring combines database performance information with broader application and infrastructure observability.
Its documented capabilities include query metrics, query samples, execution-plan information, and database host insights.
This approach is useful when development and operations teams need to understand relationships between database behavior and application performance.
Strengths: Cross-layer visibility, query diagnostics, and integration with a broader observability environment.
Considerations: Database-engine support, collection permissions, deployment requirements, and pricing should be reviewed for the intended workload.
Datadog is particularly relevant to organizations already using its monitoring ecosystem.
SolarWinds Database Performance Analyzer
SolarWinds Database Performance Analyzer focuses on database performance analysis across supported database engines.
Its approach emphasizes identifying where database operations spend time waiting.
This can help administrators investigate resource contention and inefficient queries.
Strengths: Database-focused diagnostics, wait-time analysis, and cross-platform performance visibility.
Considerations: Buyers should validate database compatibility, licensing, deployment architecture, and the level of query detail available for each engine.
It is relevant to organizations that need dedicated database performance analysis rather than only general infrastructure dashboards.
Redgate Monitor
Redgate Monitor, previously known as SQL Monitor, provides database monitoring and diagnostic capabilities.
It is designed for database teams managing database environments that may include SQL Server and other supported engines.
Strengths: Database-focused monitoring, operational visibility, and centralized investigation workflows.
Considerations: Organizations should verify the supported database versions, deployment model, security requirements, and licensing structure.
Redgate Monitor may appeal to teams that want a dedicated operational view of their database estate.
Percona Monitoring and Management
Percona Monitoring and Management, or PMM, is an open-source database monitoring and observability platform.
It is relevant to teams managing supported open-source database technologies.
Its capabilities include performance metrics, dashboards, and query analysis.
Strengths: Open-source availability, database-specific observability, and flexibility for self-managed environments.
Considerations: Deployment, maintenance, access control, and infrastructure requirements remain the organization’s responsibility.
PMM is worth considering when teams want greater control over their monitoring infrastructure.
pganalyze
pganalyze specializes in PostgreSQL performance monitoring and optimization.
Its focus includes query performance, execution plans, and PostgreSQL-specific operational insights.
Strengths: Specialized PostgreSQL diagnostics and performance analysis.
Considerations: It is not intended to replace a broad monitoring platform for every database engine.
For organizations whose most important workloads run on PostgreSQL, a specialized product may provide more relevant insight than a general monitoring dashboard.
Native Database Monitoring
Many database engines already provide useful monitoring capabilities.
PostgreSQL includes system views and statistics facilities.
MySQL offers performance instrumentation through features such as Performance Schema.
Microsoft SQL Server provides dynamic management views and related diagnostic capabilities.
Managed cloud database services also offer monitoring integrations.
These native features can be sufficient for smaller environments or serve as the foundation for more advanced monitoring systems.
Database Monitoring vs. Application Performance Monitoring
Database monitoring and Application Performance Monitoring, or APM, answer related but different questions.
APM helps teams understand how applications behave.
It may show slow web requests, failing services, and application dependencies.
Database monitoring examines database-specific behavior, including query execution, locks, waits, connections, and storage activity.
The distinction becomes important during troubleshooting.
An APM platform may reveal that a checkout request spends most of its time waiting for a database response.
A database monitoring tool may then identify the query, execution plan, or blocking transaction responsible.
Organizations benefit when these systems share enough context to connect user-facing problems with database-level causes.
How to Choose Database Monitoring Software
Start by listing the database engines and deployment environments.
A company running one PostgreSQL instance has different requirements from an enterprise managing hundreds of databases across multiple cloud providers.
Next, identify the most expensive operational problems.
Are administrators struggling with slow queries, unexpected outages, replication failures, or insufficient capacity planning?
Prioritize capabilities that address those problems.
Then evaluate monitoring depth.
Some tools provide host metrics and basic availability alerts.
Others provide detailed query histories, execution plans, wait analysis, and application correlation.
More advanced functionality can be valuable, but only when teams have the knowledge and processes to use it.
Finally, consider operational cost.
Monitoring systems may require agents, storage, network bandwidth, administrative maintenance, and subscription fees.
A product trial should measure both diagnostic value and overhead.
Designing Alerts That Teams Can Actually Use
An alerting system becomes ineffective when it produces too many notifications.
If every temporary increase in CPU utilization triggers an emergency alert, administrators may begin ignoring important messages.
Useful alerts should connect technical conditions to operational consequences.
For example, sustained connection exhaustion may justify urgent attention because applications cannot establish new database sessions.
A gradual storage increase may require a planning notification rather than an immediate incident.
Alert thresholds should account for normal workload patterns.
Teams should also establish ownership and escalation procedures.
Every critical alert needs a responsible team and a clear investigation path.
Monitoring Database Changes
Many performance incidents follow changes in application code, database schema, or infrastructure configuration.
A new index may improve one query while increasing write overhead.
A schema migration may introduce locking.
A new application release may dramatically increase database connections.
Monitoring systems should help teams compare behavior before and after changes.
This requires historical data and useful deployment context.
When possible, connect monitoring records with deployment events and change-management information.
The objective is to shorten the time between observing a problem and understanding its cause.
Database Monitoring in Cloud Environments
Cloud databases reduce some infrastructure responsibilities, but they do not eliminate performance management.
Managed services may handle selected maintenance, backups, or infrastructure operations.
Application teams still need to understand query efficiency, connection behavior, transaction patterns, and capacity usage.
Cloud environments also introduce cost considerations.
Inefficient queries may consume additional compute resources or increase the need for larger database instances.
Monitoring can therefore support both reliability and cost optimization.
However, organizations should not assume every managed service exposes the same diagnostic information.
Evaluate the metrics and permissions available for the actual database service.
Common Database Monitoring Mistakes
Monitoring Only CPU and Memory
Infrastructure metrics cannot explain every database problem.
Teams also need query, transaction, connection, and wait information.
Ignoring Historical Trends
A snapshot may show that performance is poor without explaining when the problem began.
Historical comparisons help identify regressions and capacity trends.
Creating Too Many Alerts
Excessive notifications reduce trust in the monitoring system.
Prioritize actionable alerts with clear ownership.
Overlooking Monitoring Overhead
Detailed telemetry collection consumes resources.
Organizations should evaluate collection frequency, data retention, and query-sampling behavior.
Treating Recommendations as Automatic Fixes
A monitoring platform may suggest an index or query change.
That recommendation still requires evaluation.
An index can improve reads while increasing storage requirements and write costs.
Building a Practical Monitoring Strategy
Begin with database availability, connection usage, storage capacity, and critical error conditions.
Add query performance visibility for business-critical workloads.
Then monitor locking, replication, and transaction behavior where relevant.
Establish performance baselines during normal operating periods.
Use these baselines to recognize meaningful deviations.
Next, connect database monitoring to application and infrastructure telemetry.
Finally, review alerts and dashboards regularly.
Remove metrics that create noise without supporting decisions, and add measurements when investigations reveal visibility gaps.
A successful monitoring system evolves with the applications it supports.
Frequently Asked Questions
What is the best database monitoring tool?
The best tool depends on the database environment. Datadog supports broader observability workflows, while SolarWinds DPA, Redgate Monitor, PMM, and pganalyze address different database-focused requirements.
Can database monitoring prevent outages?
Monitoring can identify warning signs and support faster intervention. It cannot guarantee that outages will never occur.
Are open-source database monitoring tools reliable?
Open-source tools can provide substantial monitoring capabilities. Their effectiveness depends on deployment quality, maintenance, configuration, and operational expertise.
Does database monitoring slow down performance?
Monitoring introduces some overhead. The impact depends on collection methods, query sampling, database configuration, and workload characteristics.
Is database monitoring necessary for managed cloud databases?
Yes, when application performance and reliability matter. Managed infrastructure does not eliminate inefficient queries, connection problems, or application-level bottlenecks.
Final Thoughts
Database monitoring should help teams move from reacting to outages toward understanding performance problems before they become severe.
The most useful tools connect database metrics with actual application behavior.
Organizations should prioritize query visibility, meaningful alerts, historical analysis, and clear operational ownership.
A well-designed monitoring strategy does more than produce dashboards. It gives teams the evidence they need to maintain reliable, efficient database services.