Introduction
A real estate team sees an office utilization figure of 50 percent and starts discussing consolidation. The local workplace manager describes a different problem. On Tuesdays, every small meeting room fills and staff struggle to find quiet places to take calls. On Fridays, entire areas sit empty. The average can be accurate while supporting a costly decision if the team ignores how demand changes across the week.
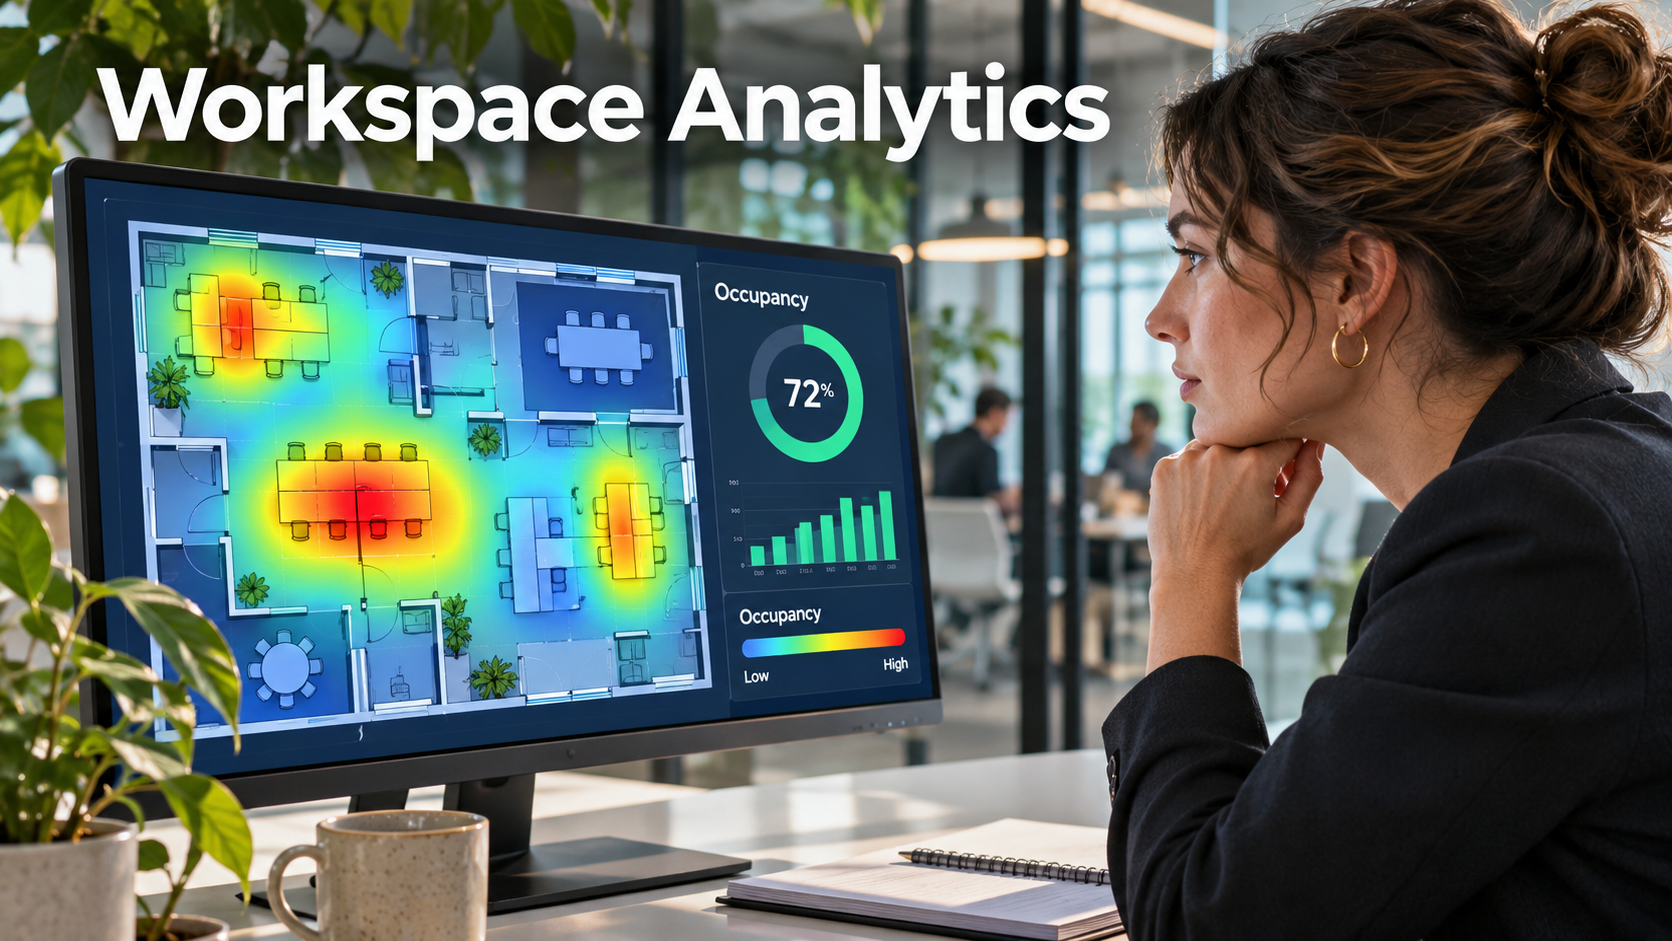
Workspace analytics tools help teams understand how people use buildings, floors, and individual types of space. They combine or analyze information from systems such as reservations, access control, and occupancy sensors. Their usefulness depends on whether the source measures the activity that the decision requires.
Begin with a decision and a unit of measurement
A team choosing where to add call booths needs a different view from one deciding whether to renew a lease. The first needs demand by space type and time of day. The second may need site-level trends, realistic capacity, and the effects of moving teams elsewhere. Agree on the question before purchasing additional data collection.
Define the denominator before discussing percentages. A floor with 100 installed desks might have 80 usable workstations during a renovation. Forty occupied seats represent 40 percent of installed capacity and 50 percent of usable capacity. A comparison across offices only makes sense when teams know which capacity each figure uses and whether closed areas remain in the calculation.
Record the interval too. A count of people present at noon is a snapshot. A count of distinct visitors across a day measures daily reach. A sum of occupied desk-hours shows duration. All three can be correct for the same office and lead to different decisions.
Understand the data sources before combining them
Reservations measure intent. People may book and stay home or use space without booking. Badge data can indicate entry to a building or controlled area, depending on where readers are installed and how records are used. A room sensor may show presence or estimate a count depending on its design. Direct observation can provide useful context in a limited sample. The U.S. General Services Administration describes several occupancy-sensing approaches and their implementation considerations.
| Source | What it can help answer | Typical blind spot to check |
|---|---|---|
| Reservations | What people tried to claim in advance | No-shows and unbooked use |
| Entry records | How much traffic reached a controlled entrance | Duration and location within the building |
| Room or desk sensors | Whether selected spaces were used during observed intervals | Installation gaps, outages, and interpretation of readings |
| Observations and interviews | Why people chose or avoided a space | Limited coverage and variation between observation periods |
Ask the vendor to show a building with a missing feed. A report that turns a dead sensor into an empty room gives the wrong impression. Check whether the interface flags stale records and whether someone can export completeness information alongside utilization. Show historical changes to room names or floor boundaries. A trend that silently combines different areas can be misleading even when every individual reading is valid.
Look at peaks, patterns, and unmet demand together
Imagine an office with 120 usable desks. Monday through Thursday peaks are 84, 114, 111, and 93. Friday peaks at 38. An average of the five daily peaks is 88 desks. Reducing capacity to 90 based on that average would create a recurring problem on the busiest days unless the organization can change when people come in or where they work.
Look at when the peaks recur and why. A scheduled monthly town hall may be manageable with temporary seating or a different room layout. A repeated Tuesday bottleneck affecting several departments may require a permanent change. Exclude abnormal closures from some comparisons and keep them visible where they affect planning. Document the choice so a reader can reproduce the result.
Watch for demand the system never records. An employee who expects every booth to be taken may stop looking for one. A team might reserve a room for eight because no suitable four-person room exists. Pair utilization data with failed searches, room swaps, or short interviews. These details can reveal whether the issue is overall capacity or an imbalance in the kinds of space available.
Make privacy and data quality part of the rollout
Space planning often works with aggregated measurements. Decide which questions require building, floor, or room-level detail and who should see those views. Review retention, access, and reporting rules with the people accountable for workplace data. In a small group, a highly detailed breakdown can reveal more about individual behavior than a portfolio summary.
Use the pilot to compare the same interval across sources. Choose a few representative spaces and observe them during both busy and quiet periods. Reconcile the counts with reservations and sensors, and record known reasons for disagreement. An occupied room with no booking may reveal walk-up behavior. A reserved room showing no presence may point to a canceled meeting or a sensor issue. Investigate the discrepancy before changing policy.
Buy the ability to explain the next decision
For a short study, a set of well-designed observations and reliable booking exports may answer the question. A portfolio that needs a continuing view across many sites may justify a dedicated tool, provided the organization can maintain consistent definitions and interpret data gaps. Include installation, maintenance, and analyst time when comparing quotes.
Ask a facilities analyst to reproduce one chart from its source data. Then ask a local workplace manager whether the result matches what they see, and where the two views disagree. The report is ready to support a decision when the team can explain the population, the time window, the missing data, and the plausible reasons for the pattern. That matters most when a utilization percentage is about to become a lease, staffing, or renovation decision.