Introduction
A machine learning training job runs on an expensive GPU server, but its performance remains disappointing.
Monitoring dashboards show that the GPUs are allocated and available. Yet training progresses slowly, memory consumption appears high, and adding more accelerators produces little improvement.
The obvious response might be to upgrade hardware or increase the number of GPUs.
That decision can be costly and ineffective.
The underlying problem may involve slow data loading, inefficient GPU kernels, memory transfers, CPU scheduling, communication overhead, or poor workload coordination.
GPU observability and profiling tools help engineers distinguish between these possibilities.
However, infrastructure monitoring and application profiling answer different questions. Understanding that distinction is essential before selecting tools or interpreting performance data.
GPU Observability and GPU Profiling Are Not the Same
GPU observability focuses on understanding the operational state of accelerator infrastructure.
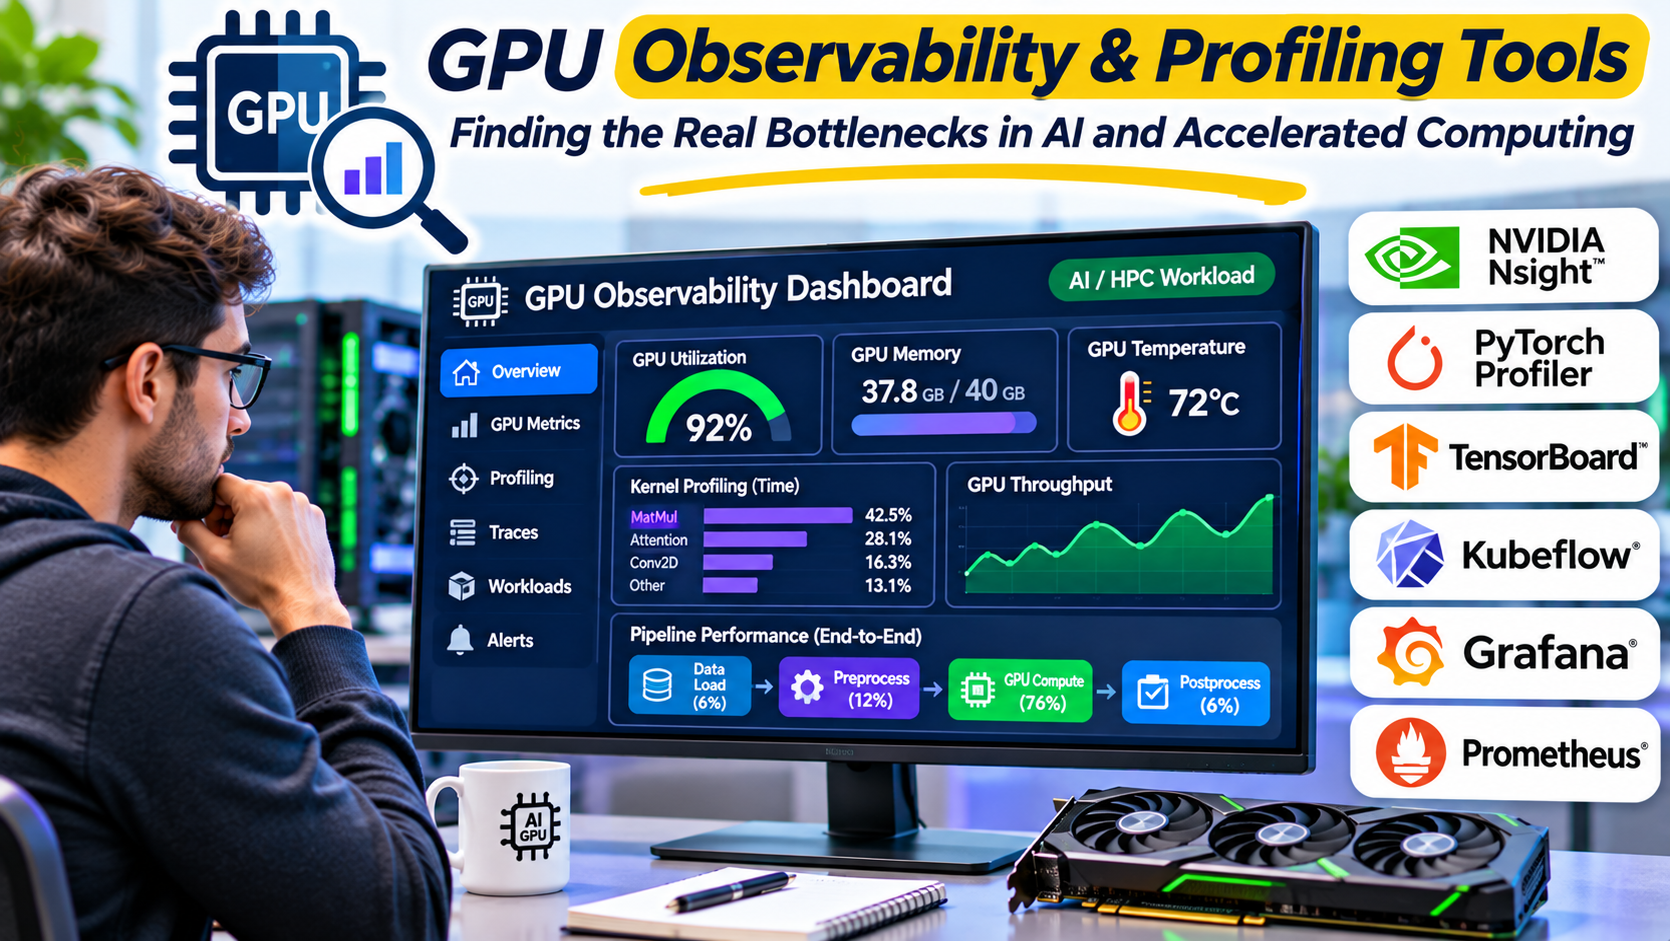
It typically involves collecting metrics such as GPU utilization, memory consumption, temperature, power usage, and hardware health.
These measurements help operators identify resource pressure, failures, and unusual workload behavior.
GPU profiling investigates how an application uses the accelerator.
Profilers can expose kernel execution timelines, memory transfers, hardware performance counters, and synchronization behavior.
The distinction matters because a monitoring dashboard may reveal that a GPU is underutilized without explaining why.
A profiler can help identify the application-level cause.
For production environments, both approaches are often necessary.
The GPU Performance Investigation Stack
A useful GPU performance investigation moves through several layers.
Infrastructure Health
The first question is whether the hardware is operating normally.
Relevant signals include temperature, power consumption, memory errors, device availability, and hardware health events.
These metrics help identify physical or operational problems.
Workload Utilization
The next question is whether applications are using the allocated resources effectively.
GPU utilization, memory occupancy, and workload attribution can reveal idle resources or unexpected competition.
However, utilization alone does not establish useful work.
A GPU can be busy executing inefficient operations.
Application Timeline
System profiling examines how CPU and GPU activities interact.
This can reveal periods when accelerators wait for data, synchronization, or kernel dispatches.
Kernel-Level Behavior
Kernel profiling investigates individual GPU operations.
It can help identify memory access inefficiencies, compute bottlenecks, and other low-level performance issues.
Distributed Communication
Multi-GPU workloads introduce communication and synchronization overhead.
Performance investigations may need to examine collective operations, network behavior, and coordination between devices.
Comparing GPU Observability and Profiling Tools
| Tool | Primary role | Most relevant use |
|---|---|---|
| NVIDIA DCGM | GPU management, health, and telemetry | NVIDIA data center GPU operations |
| NVIDIA DCGM Exporter | Exposing GPU telemetry to Prometheus | Cluster monitoring |
| NVIDIA Nsight Systems | System-wide application profiling | CPU-GPU timeline analysis |
| NVIDIA Nsight Compute | Detailed CUDA kernel profiling | Kernel optimization |
| PyTorch Profiler | Framework-level performance analysis | PyTorch model workloads |
| TensorBoard | Visualization of supported training and profiling data | ML workflow analysis |
| AMD rocprofv3 | AMD GPU tracing and counter collection | ROCm workload profiling |
| AMD ROCm Systems Profiler | System-wide AMD workload profiling | CPU-GPU and distributed analysis |
| AMD ROCm Compute Profiler | AMD GPU kernel performance analysis | Low-level kernel optimization |
| Prometheus and Grafana | Metrics collection and visualization | Monitoring dashboards and alerts |
These tools are not all direct competitors.
Some collect infrastructure metrics, others analyze individual kernels, and others visualize data produced by separate instrumentation systems.
NVIDIA DCGM: Monitoring Accelerator Infrastructure
NVIDIA Data Center GPU Manager, commonly called DCGM, supports management and monitoring of supported NVIDIA data center GPUs.
It provides access to telemetry and diagnostic capabilities relevant to infrastructure operations.
DCGM is especially useful when administrators need visibility across multiple accelerator-equipped servers.
Typical operational questions include:
- Are GPUs reporting expected health information?
- Is memory usage approaching capacity?
- Are devices operating under unusual thermal conditions?
- Are workloads consuming allocated resources?
- Are hardware-related errors appearing?
These questions are different from determining whether a particular CUDA kernel is efficiently written.
DCGM helps establish the operational context for further investigation.
DCGM Exporter With Prometheus and Grafana
DCGM Exporter makes selected NVIDIA GPU telemetry available in a format that Prometheus can collect.
Prometheus stores time-series metrics, while Grafana can visualize them in dashboards.
This combination is useful for teams already operating a Prometheus-based monitoring environment.
For example, an infrastructure team may build dashboards showing GPU memory usage, utilization, temperature, and selected health indicators across a cluster.
Alerts can then identify conditions requiring investigation.
However, collecting more metrics is not automatically better.
Excessive metric cardinality, unnecessary labels, and aggressive collection settings can increase monitoring overhead.
Administrators should select metrics according to operational needs.
NVIDIA Nsight Systems: Understanding the Entire Application Timeline
Nsight Systems provides system-wide performance analysis.
It helps developers understand how CPU activity, GPU operations, and other application components interact over time.
This is valuable because a slow GPU workload is not necessarily caused by slow GPU computation.
Consider a training application that repeatedly waits for batches of data.
The GPU may execute its kernels efficiently but spend substantial time waiting for the next batch.
Optimizing the kernels would produce limited improvement.
A system timeline can help reveal the waiting periods and direct attention toward the data pipeline.
Nsight Systems is therefore often a sensible starting point for application-level performance investigations.
NVIDIA Nsight Compute: Analyzing Individual CUDA Kernels
Nsight Compute focuses on detailed profiling of CUDA kernels.
It provides hardware-related performance metrics and analysis capabilities that help developers investigate kernel behavior.
Relevant areas include memory throughput, compute utilization, and execution efficiency.
For example, a kernel may spend substantial time waiting on memory access rather than performing arithmetic operations.
A kernel-level profiler can help determine whether memory access patterns or other execution characteristics deserve attention.
However, low-level profiling requires technical interpretation.
A single metric rarely explains an entire performance problem.
Developers should compare results with a baseline and consider how individual kernels contribute to total application execution time.
PyTorch Profiler: Understanding Model Execution
PyTorch Profiler is particularly useful for engineers developing models with PyTorch.
It can help analyze supported CPU and accelerator activities associated with model execution.
This creates a bridge between framework-level operations and lower-level performance behavior.
A developer may discover that a particular model operation consumes unexpected time or that repeated transfers create overhead.
Framework profiling is valuable because optimization decisions can often be made without immediately rewriting GPU kernels.
For example, adjusting batching, data movement, or model execution patterns may produce more meaningful improvements than low-level changes.
The profiler should be configured carefully because collecting detailed traces can affect workload performance and generate large output files.
AMD ROCm Profiling Tools
AMD’s ROCm ecosystem includes profiling tools for applications running on supported AMD accelerators.
The modern ROCm profiling stack separates system-level analysis from kernel-level investigation.
rocprofv3
rocprofv3 provides command-line access to tracing and profiling capabilities built on ROCprofiler-SDK.
It can collect information about supported GPU activities and hardware counters.
This makes it useful for repeatable profiling workflows and scripted investigations.
ROCm Systems Profiler
ROCm Systems Profiler provides a broader view of application execution.
It can help investigate CPU activity, GPU work, and selected distributed computing behavior.
This is relevant when an accelerator appears idle because of work occurring elsewhere in the system.
ROCm Compute Profiler
ROCm Compute Profiler focuses on kernel-level performance analysis.
It supports investigations into hardware utilization and memory behavior on supported AMD platforms.
These AMD tools should be selected according to the installed ROCm version, accelerator architecture, and supported features.
Legacy profiling commands should not be assumed to remain the preferred interface.
Why GPU Utilization Can Be Misleading
GPU utilization is one of the most frequently displayed accelerator metrics.
It is also one of the easiest to misinterpret.
High utilization does not necessarily mean an application is achieving good performance.
A workload may keep the GPU busy while performing inefficient memory operations.
Similarly, low utilization does not automatically indicate a hardware problem.
An application may be waiting for input data or synchronizing with another process.
The correct interpretation requires additional context.
Useful supporting measurements include application throughput, kernel execution time, memory behavior, and CPU-GPU interaction.
The goal is to connect resource activity to useful application progress.
Memory Capacity and Memory Bandwidth Are Different Problems
GPU memory issues can appear in several forms.
An application may exceed available memory capacity.
Alternatively, it may fit comfortably within memory but access data inefficiently.
These problems require different solutions.
Memory capacity pressure may justify smaller batches, reduced memory usage, or different model execution strategies.
Memory bandwidth limitations may require changes to data access patterns or computational organization.
A monitoring dashboard showing memory allocation cannot, by itself, establish whether memory bandwidth is the main bottleneck.
Detailed profiling is often necessary.
A Practical GPU Performance Investigation
A disciplined workflow reduces the risk of optimizing the wrong component.
Step 1: Establish a Baseline
Record meaningful application performance measurements.
For model training, this may include samples processed per second or time per training step.
For inference, relevant measurements may include latency, throughput, and resource consumption.
Use representative workloads.
Step 2: Check Infrastructure Health
Review hardware availability, errors, temperature, power, and memory conditions.
Resolve obvious infrastructure problems before making application changes.
Step 3: Examine Workload Utilization
Identify whether GPUs are consistently busy, intermittently idle, or experiencing resource contention.
Compare these observations with application progress.
Step 4: Capture a System Timeline
Use an appropriate system profiler to investigate CPU-GPU interaction.
Look for waiting periods, repeated synchronization, unnecessary transfers, and delayed kernel execution.
Step 5: Profile Important Kernels
Focus detailed profiling on operations that materially affect overall execution time.
Avoid spending substantial effort optimizing kernels that contribute little to total runtime.
Step 6: Change One Major Variable
Apply a targeted optimization.
Then repeat the measurement under comparable conditions.
Changing several unrelated settings at once makes it difficult to determine which modification produced an improvement.
Step 7: Validate the Result
Confirm that performance improves without introducing unacceptable memory use, instability, or correctness problems.
Optimization should preserve the application’s required behavior.
GPU Observability in Kubernetes
Kubernetes introduces additional operational considerations.
GPU resources may be allocated through device plugins and other scheduling mechanisms.
Monitoring needs to distinguish between node-level GPU activity and the workloads responsible for it.
A cluster dashboard that shows only aggregate GPU utilization may be insufficient.
Operators may need visibility into pods, namespaces, resource allocations, and supported workload attribution.
DCGM Exporter can participate in this architecture for supported NVIDIA environments.
However, workload labels and GPU-sharing configurations require careful setup.
Monitoring should also account for the possibility that allocated GPUs remain idle because applications are waiting on unrelated resources.
Multi-GPU and Distributed Training Challenges
Distributed training introduces bottlenecks beyond individual GPU performance.
Several accelerators may need to exchange gradients, synchronize operations, or coordinate access to shared resources.
If one device or process progresses more slowly, other workers may spend time waiting.
Adding more GPUs can therefore increase total resource cost without delivering proportional throughput gains.
System-level profiling and communication analysis help identify these problems.
Teams should examine the relationship between computation, communication, and data loading.
The relevant metric is not simply the number of GPUs in use.
It is the useful work completed per unit of time and cost.
Profiling Overhead and Measurement Quality
Profiling tools can change the behavior of the application being measured.
Detailed tracing may increase execution overhead, consume storage, or affect timing.
Some hardware counter collection methods also require repeated measurements.
For reliable conclusions, engineers should distinguish between production monitoring and intensive diagnostic profiling.
Continuous monitoring generally favors relatively low-overhead metrics.
Detailed profiling is often performed during controlled investigations.
Repeat measurements where possible and document the workload, software environment, and profiling configuration.
Choosing Tools for NVIDIA, AMD, and Mixed Environments
Hardware compatibility is a central selection criterion.
NVIDIA-specific tools depend on supported NVIDIA hardware, drivers, and software environments.
AMD ROCm profiling tools serve supported AMD accelerator workloads.
Framework-level tools such as PyTorch Profiler can provide useful higher-level information, but their capabilities still depend on the underlying execution environment.
Mixed environments may require several monitoring and profiling systems.
A single dashboard can aggregate selected infrastructure metrics, but it does not automatically provide equivalent low-level profiling across every GPU architecture.
Operational Costs and Tool Selection
Many important GPU profiling tools are available through hardware vendor or open-source ecosystems.
However, licensing cost is not the only consideration.
Operational expenses can include:
- Telemetry collection infrastructure
- Metrics storage and retention
- Dashboard development
- Profiling data storage
- Engineering investigation time
- Cluster administration
- Training for performance analysis
- Performance overhead during profiling
A monitoring platform that generates large quantities of unused data can become expensive without improving decisions.
Similarly, a sophisticated profiler offers limited value if engineers lack the time or expertise to interpret its output.
Start with the measurements needed to answer specific operational questions.
Frequently Asked Questions
What is the difference between GPU monitoring and profiling?
Monitoring tracks operational metrics over time. Profiling investigates how applications and kernels use GPU resources.
Is high GPU utilization always good?
No. High utilization can coexist with inefficient computation or memory access. Application throughput and profiling results provide necessary context.
Which tools are useful for NVIDIA GPUs?
NVIDIA DCGM, DCGM Exporter, Nsight Systems, and Nsight Compute address different monitoring and profiling needs.
Which tools support AMD GPU profiling?
AMD’s ROCm ecosystem includes rocprofv3, ROCm Systems Profiler, and ROCm Compute Profiler for supported environments.
Can Prometheus identify GPU kernel bottlenecks?
Prometheus is useful for collecting operational metrics, but detailed kernel analysis generally requires specialized profiling tools.
Should GPU profiling run continuously in production?
Lightweight monitoring is commonly appropriate for continuous use. Detailed profiling should be evaluated for overhead, data volume, and operational impact.
Final Thoughts
GPU observability and profiling tools help organizations understand why expensive accelerator resources are not always delivering expected results.
Infrastructure monitoring establishes whether devices are healthy and how resources are being used.
System profiling reveals interactions between CPUs, GPUs, data pipelines, and distributed components.
Kernel profiling provides the detailed evidence needed for low-level optimization.
For NVIDIA environments, DCGM and Nsight tools cover complementary layers. AMD provides corresponding capabilities through its ROCm profiling ecosystem.
The most effective strategy is to begin with application performance, identify the layer responsible for the bottleneck, and select the tool that can investigate that layer.
Better measurements lead to better optimization decisions—and often provide more value than purchasing additional hardware.