Introduction
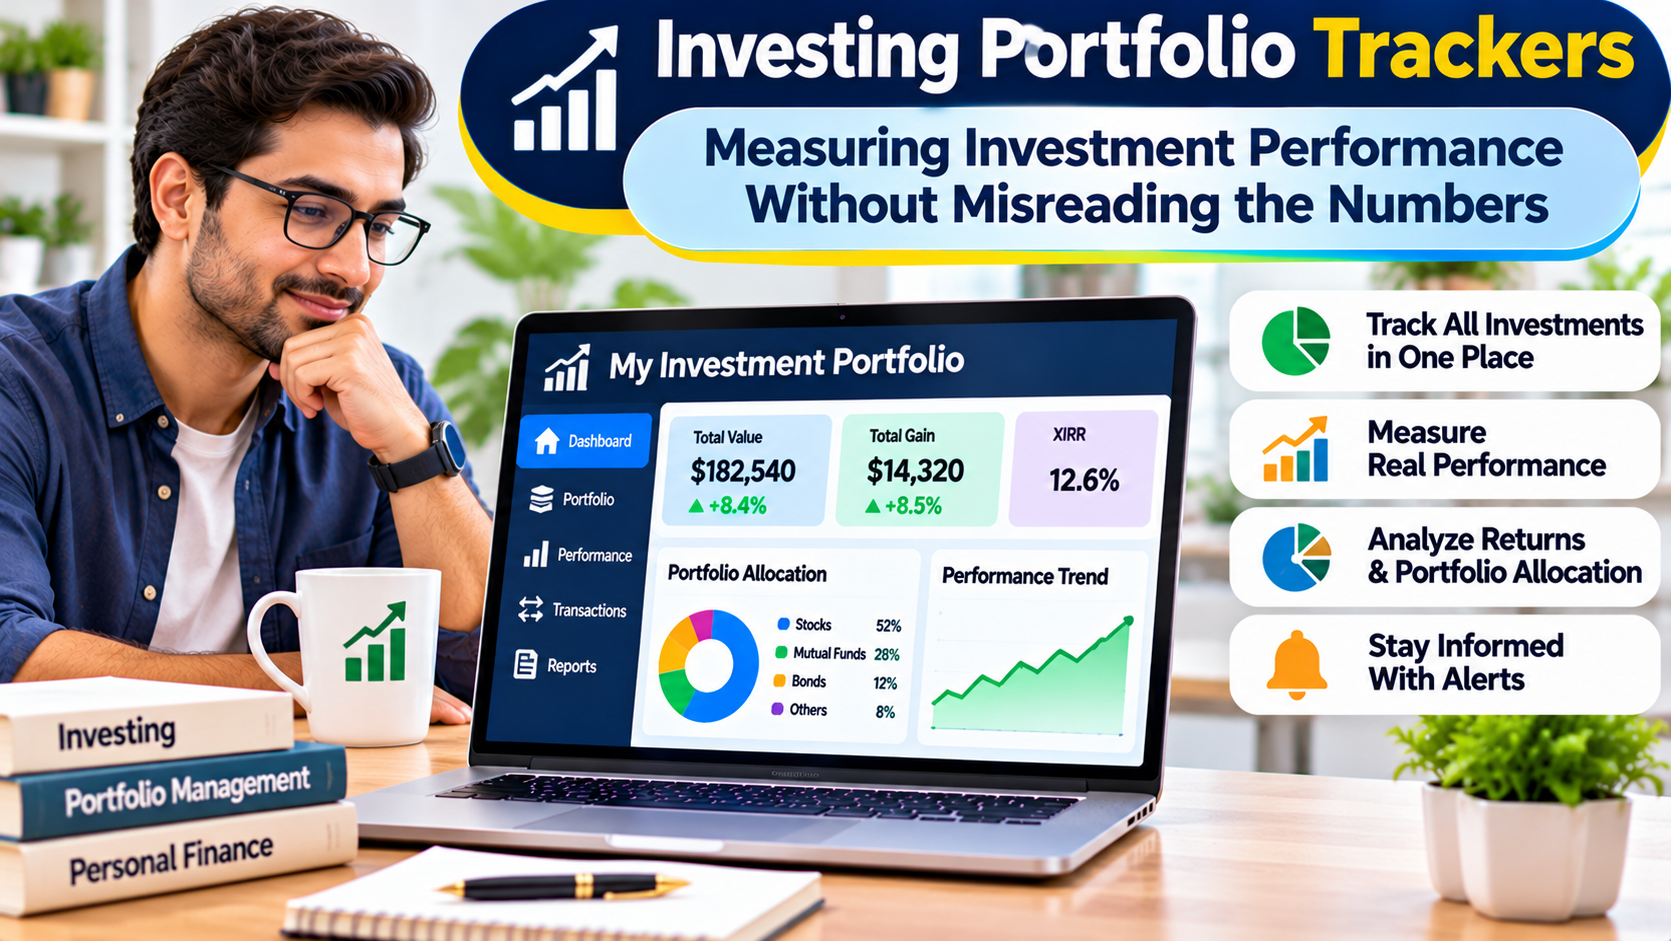
An investor opens a portfolio dashboard and sees a positive return.
The account balance has increased, the performance chart is rising, and the application displays an encouraging percentage.
But what does that percentage actually measure?
It may represent a change in market value, a return that includes dividends, or a calculation affected by deposits and withdrawals. Different methods can produce different results from the same investment history.
This is the central challenge of investing portfolio trackers.
They collect investment information and present it in a convenient format, but the accuracy and usefulness of their reports depend on data quality and calculation methods.
A reliable tracker should help investors understand what they own, how their holdings are distributed, and how performance has changed.
It should not create false confidence through attractive charts or poorly explained numbers.
This guide examines the calculations, data sources, portfolio structures, and practical features that matter when choosing investment tracking software.
What Is an Investing Portfolio Tracker?
An investing portfolio tracker is software that organizes information about investment holdings and their performance.
It may track stocks, exchange-traded funds, mutual funds, bonds, cash, and other assets.
Depending on the product, users can connect brokerage accounts, import transactions, or enter holdings manually.
Common features include portfolio valuation, asset allocation, dividend records, performance charts, and investment reports.
Some platforms also offer market research, watchlists, financial planning, or investment analysis.
These additional features should not obscure the tracker’s core responsibility: maintaining an accurate record of the portfolio.
A Portfolio Balance Is Not the Same as Investment Performance
Suppose an investor begins with ₹100,000.
During the year, the investor adds another ₹50,000.
At the end of the period, the account is worth ₹165,000.
The account balance has increased by ₹65,000.
However, ₹50,000 of that increase came from new contributions.
The investment gain is ₹15,000 before considering any other relevant adjustments.
A dashboard that presents the entire balance increase as investment performance would be misleading.
This is why transaction histories matter.
A tracker must distinguish market movements from deposits, withdrawals, transfers, dividends, and fees.
Understanding the Main Return Calculations
Absolute Return
Absolute return describes the gain or loss relative to an investment amount.
For a simple investment with no additional transactions, the calculation is straightforward.
If an investment rises from ₹100,000 to ₹110,000, the gain is ₹10,000, or 10%.
However, this simple calculation becomes less informative when contributions and withdrawals occur at different times.
Time-Weighted Return
Time-weighted return aims to measure investment performance while reducing the influence of external cash flows.
It divides the investment period into segments around relevant cash flows and compounds the subperiod returns.
This method can be useful when comparing investment strategies or managers because it separates performance from the timing of investor contributions.
However, accurate calculations require appropriate valuations around cash-flow events.
Money-Weighted Return
Money-weighted return accounts for the timing and size of cash flows.
It is closely related to the internal rate of return.
This approach reflects the investor’s actual experience more directly when money enters and leaves the portfolio at different times.
However, it may differ substantially from time-weighted return.
Neither method is universally correct for every question.
The important point is to know which calculation the tracker uses.
Total Return
Total return considers relevant changes in investment value along with distributions such as dividends or interest.
A price-only chart may understate the economic return of an income-producing investment.
Investors should verify whether displayed returns include distributions and how reinvestment is handled.
The Data Quality Problem
Even a mathematically correct calculation can be wrong when the underlying records are incomplete.
A tracker may show inaccurate results because a dividend is missing, a stock split was not processed correctly, or a transaction was imported twice.
These issues can remain hidden behind polished charts.
Corporate Actions
Corporate actions can change the number or nature of securities held.
Examples include stock splits, mergers, spin-offs, and certain distributions.
A portfolio tracker should handle relevant corporate actions without treating them as ordinary purchases or sales.
Investors should verify how historical transactions and cost bases are adjusted.
Dividends and Interest
Income records need to distinguish between cash received and amounts reinvested.
A reinvested dividend increases the number of units held but should not be confused with a new external contribution.
Incorrect treatment can distort performance.
Fees
Trading commissions, account fees, and other charges can affect investor outcomes.
Some trackers report gross performance, while others can account for relevant fees.
Users should understand the treatment of expenses before comparing results.
Manual Tracking Versus Brokerage Connections
Portfolio trackers generally collect information in one of three ways.
Manual Entry
Users enter holdings and transactions themselves.
This provides direct control and may support accounts that cannot connect automatically.
The disadvantage is maintenance.
Missing or incorrectly entered transactions can produce misleading reports.
File Imports
Some applications accept statements or transaction files.
This approach can reduce data entry without requiring a continuous account connection.
However, import formats vary.
Users may need to clean files or resolve duplicates.
Automatic Account Connections
Connected brokerage accounts can simplify ongoing tracking.
Yet compatibility depends on the financial institution, country, connection provider, and account type.
A connection may provide holdings without complete transaction history.
Some systems may also experience synchronization delays.
Automatic import should be treated as a convenience, not proof of accuracy.
Investing Portfolio Trackers Worth Evaluating
Different products emphasize different aspects of portfolio management.
Sharesight
Sharesight focuses on investment portfolio tracking, performance measurement, and reporting.
Its approach is relevant to investors who want to examine holdings, distributions, and investment results across supported assets.
It is particularly worth evaluating when dividend records and return calculations are important.
Users should verify supported exchanges, account imports, tax-related reports, and plan limitations for their location.
Portfolio Performance
Portfolio Performance is an open-source desktop application designed for tracking investment portfolios.
It provides detailed portfolio accounting and performance analysis.
Its approach may appeal to users who want greater control over their data and are comfortable maintaining records.
The trade-off is that setup and ongoing reconciliation may require more effort than a fully connected service.
Investors should assess whether its data sources and supported workflows fit their portfolios.
Snowball Analytics
Snowball Analytics emphasizes portfolio visibility and investment analysis, including income-oriented tracking.
It may interest investors who want to monitor dividends, allocation, and holdings through a consolidated dashboard.
Buyers should evaluate the accuracy of imported transactions, supported markets, and the assumptions behind projected income figures.
Forecasted distributions should not be mistaken for guaranteed future payments.
Kubera
Kubera focuses on consolidated wealth tracking across different asset categories.
Its broader approach may be relevant to people who want a view of investments alongside other assets and liabilities.
However, consolidated net worth is different from detailed investment performance analysis.
Users should determine whether the product provides the return calculations and transaction-level records they need.
Brokerage-Native Portfolio Tools
Many brokerages provide portfolio dashboards within their own applications.
These can be convenient because holdings and transactions originate from the brokerage’s records.
However, they may provide limited visibility into assets held elsewhere.
A separate tracker becomes more valuable when an investor has multiple accounts or needs independent performance analysis.
Comparing Trackers by Their Primary Strength
| Tracking requirement | Type of solution to evaluate |
|---|---|
| Detailed return and dividend reporting | Investment performance tracker |
| Control over locally maintained records | Desktop or open-source portfolio software |
| Income-focused portfolio monitoring | Dividend and income analytics platform |
| Investments alongside property and other assets | Consolidated wealth tracker |
| One brokerage account with simple holdings | Brokerage’s own dashboard |
| Multiple institutions and asset types | Multi-account portfolio aggregator |
This framework avoids the common mistake of comparing products that answer different financial questions.
Asset Allocation: More Than a Pie Chart
Asset allocation describes how a portfolio is distributed among asset categories.
A tracker may show percentages assigned to equities, fixed income, cash, or other investments.
However, classification methods matter.
For example, a broad equity fund may contain companies from many sectors and countries.
A simple tracker might classify the entire fund as one asset.
A more detailed system may provide look-through analysis that estimates underlying exposures.
Neither presentation is automatically wrong, but they answer different questions.
Investors should understand whether allocation reports reflect direct holdings or underlying fund components.
Geographic and Sector Exposure
Investors may want to understand how concentrated their holdings are.
A portfolio could contain several funds yet remain heavily exposed to the same companies or sectors.
Some trackers provide geographic, industry, or security-level breakdowns.
The usefulness of these reports depends on data coverage and classification quality.
A dashboard that lacks information for certain assets may produce incomplete exposure estimates.
Missing data should be visible rather than silently excluded.
Benchmark Comparisons
Portfolio trackers often compare performance against a market index.
This can provide context.
However, benchmark selection matters.
Comparing a conservative mixed-asset portfolio with an all-equity index may create misleading expectations.
Currency, dividend treatment, and time period also affect comparisons.
A meaningful benchmark should reflect the investment exposure being evaluated.
The tracker should explain whether benchmark returns include dividends and how they are calculated.
Multi-Currency Portfolios
Investors holding assets in different currencies face another layer of complexity.
Portfolio value changes can result from both asset performance and exchange-rate movements.
For example, an overseas investment may rise in its local currency while its value in the investor’s home currency changes differently.
A useful tracker should distinguish reporting currency from the currency in which the asset trades.
Users should also understand which exchange rates are applied and when they are updated.
Historical conversion methods can materially affect reported performance.
Cost Basis and Tax Records
Cost basis is important for understanding investment gains and losses.
However, calculating it can be complicated by multiple purchases, partial sales, corporate actions, and jurisdiction-specific rules.
Some trackers offer tax-oriented reports.
These should be evaluated carefully.
A software-generated tax figure may not reflect every rule that applies to the investor.
For example, tax treatment can vary by country, asset class, holding period, and account structure.
Investors should verify relevant records against brokerage statements and applicable tax requirements.
A portfolio tracker should not be assumed to replace professional tax advice.
Tracking Dividends Without Overestimating Income
Income-focused investors often want to know how much their holdings have distributed.
A tracker can help organize dividend payments and estimate future income.
However, projected dividends depend on assumptions.
Companies and funds can change their distributions.
Currency movements can also affect income received in the investor’s reporting currency.
A forecast based on historical payments should be labeled as an estimate.
It should not be presented as a guaranteed cash flow.
Security and Account Connections
Portfolio applications may connect to financial institutions or store detailed information about investments.
Users should examine the permissions involved.
A read-only connection may present different risks from an arrangement that allows trading or transfers.
The exact access model should be confirmed.
Other important considerations include multifactor authentication, encryption, data retention, account deletion, and third-party sharing.
Users should avoid providing brokerage passwords to unfamiliar services without understanding how authentication and access are managed.
Data Portability and Long-Term Records
Investment records may need to remain useful for many years.
A portfolio tracker should make it possible to retrieve transaction histories and holdings data.
Before subscribing, investigate export formats.
Can users export individual transactions?
Are dividends, fees, and corporate actions included?
Can historical records be reconstructed in another system?
A summary of current holdings is not a complete substitute for transaction-level history.
How to Test a Portfolio Tracker
A meaningful test requires more than entering a few current holdings.
Create a small representative portfolio containing several transaction types.
Include a purchase, additional contribution, dividend, reinvestment, sale, and transfer.
If relevant, include an overseas asset and a corporate action.
Then compare the tracker against independently maintained records.
Check the current holdings, cash balance, income totals, and cost basis.
Next, examine the return calculation.
Does the software identify whether the figure is time-weighted, money-weighted, or another measure?
Finally, test export functionality.
A system that cannot explain or reproduce its numbers should not be trusted solely because its dashboard looks professional.
Common Mistakes When Using Portfolio Trackers
One mistake is comparing account balance growth with investment returns.
Another is treating price appreciation as total return while ignoring distributions.
Users may also overlook currency effects or compare performance against an unsuitable benchmark.
A further problem is assuming that imported data is complete.
Duplicate transactions, missing fees, and incorrect corporate actions can distort results.
Finally, some investors spend excessive time watching daily portfolio movements.
Frequent monitoring does not necessarily improve investment decisions.
The appropriate review frequency depends on the investor’s goals and strategy.
Frequently Asked Questions
What is the difference between a portfolio tracker and a brokerage account?
A brokerage account holds or facilitates investments. A portfolio tracker organizes and analyzes investment information, sometimes across several accounts.
Can a portfolio tracker calculate investment returns accurately?
It can when the data and calculation methods are appropriate. Users should verify cash flows, fees, distributions, and corporate actions.
What is the difference between time-weighted and money-weighted return?
Time-weighted return reduces the effect of external cash-flow timing, while money-weighted return reflects the timing and size of an investor’s contributions and withdrawals.
Do portfolio trackers support investments in every country?
No. Market coverage, brokerage connections, currencies, and reporting functions vary.
Can a portfolio tracker prepare tax returns?
Some provide tax-related reports, but these may not satisfy all applicable tax requirements. Independent verification may be necessary.
Final Thoughts
Investing portfolio trackers are most useful when they make investment records easier to understand and verify.
A reliable tracker should distinguish market gains from new contributions, explain its return calculations, account for relevant distributions, and preserve accurate transaction histories.
For some investors, a brokerage dashboard is sufficient.
Others may benefit from detailed performance software or a consolidated view across multiple accounts.
The best tracker is not the one displaying the highest reported return.
It is the one whose numbers can be understood, checked, and used to make informed decisions.