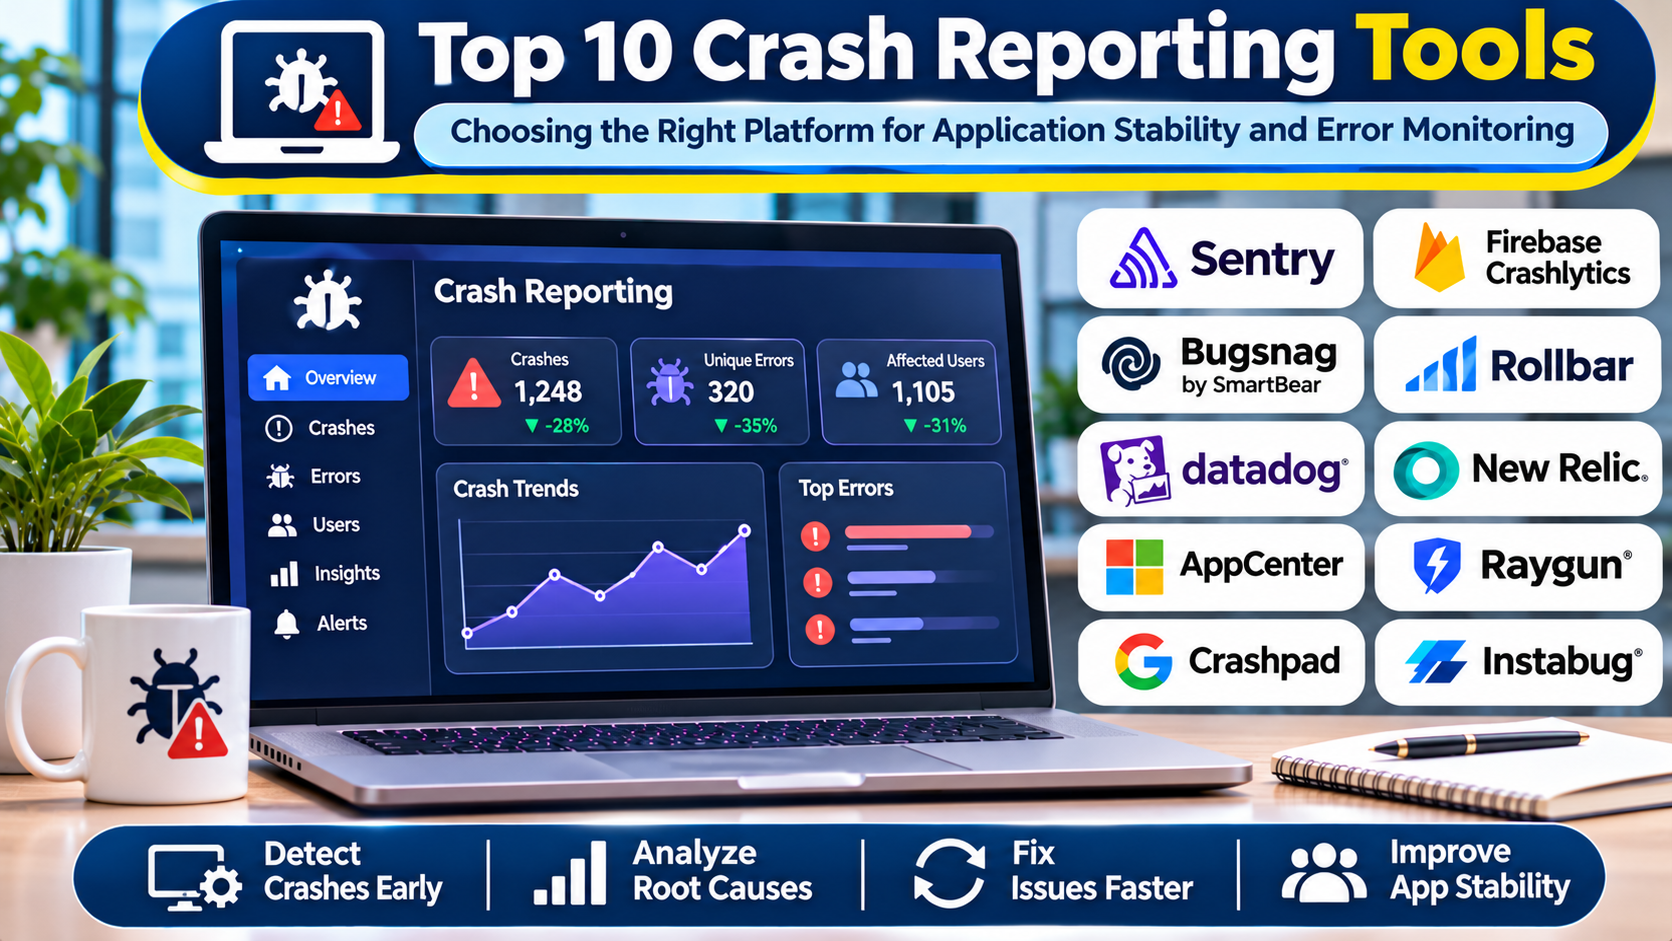
Introduction
Application crashes are among the most disruptive problems in software development. A crash can interrupt a purchase, prevent a user from accessing important information, or cause an application to lose unsaved work.
For organizations operating mobile applications, websites, desktop software, and backend services, understanding these failures is essential to maintaining reliability.
However, reproducing crashes can be difficult. A failure may occur only on a particular operating system version, device model, application release, or sequence of user actions.
Traditional application logs do not always provide enough context to identify the underlying cause.
Crash reporting tools help developers capture unexpected application failures, collect diagnostic information, group related errors, and prioritize fixes.
Modern platforms frequently provide stack traces, release tracking, affected-user estimates, alerts, breadcrumbs, and integrations with development workflows.
Some specialize in mobile application crashes, while others combine crash reporting with broader application monitoring and observability.
This guide examines ten established crash reporting tools, explains their strengths and limitations, and provides practical guidance for selecting an appropriate platform.
What Are Crash Reporting Tools?
Crash reporting tools are software systems that collect and analyze information about unexpected application failures.
When an application crashes, an integrated SDK, monitoring agent, or platform-level reporting mechanism records diagnostic information.
Depending on the application environment, this information may include exception types, stack traces, application versions, device characteristics, operating system details, and recent application events.
The collected information is transmitted to a reporting platform, where related failures can be grouped and analyzed.
Common Crash Reporting Capabilities
Crash capture: Detects supported fatal exceptions and unexpected application terminations.
Stack traces: Identifies the sequence of function calls associated with an error.
Error grouping: Combines related failures to reduce duplicate reports.
Release tracking: Associates failures with application versions and deployments.
Affected-user analysis: Estimates how many users experienced a particular problem.
Alerts: Notifies engineering teams when new or important failures occur.
Debugging context: Provides additional information about application state and events preceding a failure.
Issue integrations: Connects diagnostic findings with bug tracking and development workflows.
Crash reporting tools do not automatically identify every root cause. Developers must interpret the evidence, reproduce problems where possible, and validate fixes.
Top 10 Crash Reporting Tools
1. Firebase Crashlytics
Short Description
Firebase Crashlytics is an application crash reporting service within Google’s Firebase development ecosystem. It focuses on helping mobile application teams identify, prioritize, and resolve stability problems.
Crashlytics is particularly relevant to Android and Apple application development. Developers integrate its SDK into their applications to collect supported crash reports and nonfatal errors.
The platform groups related failures and presents information about affected users, application versions, and diagnostic details. This helps teams distinguish widespread stability problems from isolated incidents.
For example, a mobile banking application may experience a crash after releasing a new authentication feature. Crashlytics can help the development team identify the affected release, inspect the associated exception, and investigate the relevant code path.
Its integration with Firebase makes it convenient for teams already using Firebase Analytics, Remote Config, and other supported services.
Crashlytics is primarily focused on application stability rather than serving as a complete infrastructure observability platform.
Key Features
- Automatic Crash Collection: Captures supported fatal application failures through integrated SDKs.
- Nonfatal Error Reporting: Allows developers to record handled exceptions requiring investigation.
- Crash Grouping: Organizes related failures to reduce duplicate analysis.
- Stack Trace Analysis: Provides diagnostic call stacks for locating problematic code.
- Crash-Free Metrics: Helps teams monitor the proportion of users or sessions without recorded crashes.
- Release Monitoring: Associates stability information with application versions.
- Custom Keys and Logs: Adds selected application context to diagnostic reports.
- Firebase Integration: Connects crash investigation with supported Firebase services.
- Alerting: Notifies teams about important stability changes and emerging issues.
Benefits
Crashlytics provides an accessible starting point for mobile stability monitoring.
Its issue grouping and release context help teams prioritize failures affecting large numbers of users.
Integration with Firebase can reduce implementation overhead for applications already using that ecosystem.
Pros
- Strong Android and Apple application support.
- No separate charge for core Crashlytics functionality.
- Useful crash grouping.
- Release-level stability information.
- Custom diagnostic context.
- Straightforward Firebase integration.
Cons
- Primarily focused on mobile application environments.
- Less comprehensive for backend infrastructure monitoring.
- Some diagnostic context requires custom instrumentation.
- Crash reports may depend on successful upload after application restart.
- Privacy and sensitive-data handling require careful configuration.
Use Cases
Mobile release monitoring: Teams can detect stability regressions after deploying a new version.
Authentication debugging: Developers can investigate crashes occurring during login or account recovery.
Device-specific failures: Engineers can identify problems associated with particular device or operating system configurations.
Best For
Firebase Crashlytics is suitable for Android and iOS developers, mobile startups, and teams already using Firebase.
2. Sentry
Short Description
Sentry is an application monitoring platform known for error tracking, exception analysis, and developer-oriented debugging workflows.
It supports numerous application environments, including mobile applications, web frontends, backend services, and desktop software through supported SDKs.
Sentry collects errors and provides contextual information to help developers understand where and why failures occur.
Its error grouping, stack traces, breadcrumbs, release associations, and source code integrations are particularly useful for teams managing complex applications.
For example, a SaaS application may contain a React frontend, a Python backend, and mobile clients. Sentry can help teams investigate errors across these components through a connected monitoring workflow.
Sentry also offers performance-related capabilities, making it relevant to organizations that want to examine errors alongside selected application performance information.
Its broad functionality requires deliberate configuration to control event volume and maintain useful alerts.
Key Features
- Cross-Platform Error Tracking: Captures supported errors across frontend, backend, mobile, and desktop environments.
- Issue Grouping: Combines related error events into actionable issues.
- Stack Trace Diagnostics: Helps developers locate failing code paths.
- Breadcrumbs: Records selected events preceding an error to provide debugging context.
- Release Tracking: Associates errors with deployed application versions.
- Source Map and Symbol Support: Improves readability of supported minified or compiled stack traces.
- Alert Rules: Notifies teams when configured error conditions occur.
- Issue Tracker Integrations: Connects monitoring findings with development workflows.
- Performance Monitoring: Provides additional transaction and performance context where supported.
Benefits
Sentry reduces the time developers spend searching through disconnected logs.
Its cross-platform coverage helps organizations manage application errors through a consistent workflow.
Release associations and debugging context also make it easier to identify regressions introduced by recent deployments.
Pros
- Broad programming-language support.
- Detailed error diagnostics.
- Strong developer workflow integrations.
- Useful release tracking.
- Supports multiple application environments.
- Combines error and performance monitoring.
Cons
- Event volume can affect costs.
- Alert configuration requires tuning.
- Large installations need consistent project organization.
- Some features depend on subscription level.
- Sensitive diagnostic information must be filtered carefully.
Use Cases
Full-stack SaaS monitoring: Teams can investigate frontend and backend exceptions.
Mobile debugging: Developers can analyze application crashes and nonfatal errors.
Release quality management: Engineering teams can identify new issues after deployments.
Best For
Sentry is appropriate for full-stack development teams, SaaS organizations, and engineering groups requiring detailed cross-platform error monitoring.
3. Bugsnag
Short Description
Bugsnag is an application stability monitoring platform designed to help engineering teams detect errors, understand their impact, and prioritize corrective work.
It supports mobile, web, and backend application environments through supported integrations.
Bugsnag places particular emphasis on application stability and error prioritization. Rather than presenting every exception as equally important, it provides context that helps teams understand the severity and reach of a problem.
For example, an e-commerce application may experience a recurring crash affecting customers during checkout. Bugsnag can help engineers identify the affected application versions and evaluate how widely the failure occurs.
The platform also provides release-oriented stability information, making it useful for teams that frequently deploy application updates.
Bugsnag is especially relevant to organizations that want dedicated error monitoring with structured stability analysis.
Key Features
- Automatic Error Detection: Captures supported application crashes and exceptions.
- Error Grouping: Organizes similar failures into manageable issues.
- Stability Monitoring: Helps teams evaluate application reliability over time.
- Release Tracking: Associates errors with deployed application versions.
- User Impact Analysis: Provides information about the reach of supported errors.
- Diagnostic Metadata: Adds contextual details to error reports.
- Error Alerts: Notifies teams when configured conditions are met.
- Issue Management Integrations: Connects errors with development tracking systems.
- Cross-Platform SDKs: Supports monitoring across multiple application technologies.
Benefits
Bugsnag helps teams prioritize errors according to application impact.
Its stability-focused reporting supports release quality decisions and regression investigation.
Developers can also use diagnostic context to reduce the effort required to reproduce difficult failures.
Pros
- Strong application stability focus.
- Useful error prioritization.
- Release monitoring.
- Cross-platform support.
- Detailed diagnostic information.
- Development workflow integrations.
Cons
- Subscription costs require evaluation.
- Some advanced capabilities depend on plan selection.
- Correct configuration is necessary for meaningful grouping.
- Not a complete infrastructure monitoring replacement.
- Teams must manage diagnostic data privacy.
Use Cases
Mobile commerce: Developers can prioritize crashes affecting checkout completion.
Release validation: Teams can compare stability before and after application updates.
Customer-facing SaaS: Engineers can monitor recurring errors affecting important workflows.
Best For
Bugsnag is suitable for mobile product teams, SaaS companies, and organizations emphasizing application stability and release quality.
4. Instabug
Short Description
Instabug is a mobile-focused platform that combines application diagnostics with user experience and feedback capabilities.
Its crash reporting functionality helps developers investigate failures in mobile applications, while related tools provide additional context about application behavior.
Instabug is particularly relevant to organizations that want to connect technical problems with user experiences.
For example, a mobile travel application may receive complaints about a booking screen that occasionally freezes or crashes. Instabug can help the team investigate technical issues while connecting them with relevant application context.
The platform’s mobile orientation distinguishes it from general-purpose observability systems.
Its broader feature set can be valuable for product teams, although organizations seeking only basic crash reporting may not require every capability.
Key Features
- Mobile Crash Reporting: Captures supported application crashes.
- Nonfatal Error Monitoring: Records selected recoverable errors.
- Application Diagnostics: Provides technical information associated with failures.
- Session Context: Helps teams understand relevant application activity.
- User Feedback Capabilities: Supports collecting feedback through associated platform functionality.
- Release Analysis: Helps evaluate issues across application versions.
- Performance Monitoring: Provides related mobile performance capabilities.
- Issue Integrations: Connects findings with development workflows.
- Mobile SDK Support: Integrates with supported mobile development frameworks.
Benefits
Instabug helps teams investigate mobile stability problems with additional experience context.
Its combination of diagnostics and feedback can improve communication between engineering, QA, and product teams.
The platform may also reduce the need for separate tools when organizations require multiple mobile quality capabilities.
Pros
- Mobile-focused diagnostics.
- Crash and nonfatal error reporting.
- Additional user experience context.
- Feedback-related functionality.
- Performance monitoring capabilities.
- Useful for mobile product teams.
Cons
- Less relevant to backend-only applications.
- Broader functionality may increase costs.
- SDK configuration requires care.
- Privacy settings are important when collecting user context.
- Some capabilities depend on commercial plans.
Use Cases
Mobile application QA: Teams can investigate failures discovered during testing.
Customer feedback investigation: Developers can connect reported problems with technical diagnostics.
Mobile release monitoring: Organizations can identify stability issues after application updates.
Best For
Instabug is appropriate for mobile engineering teams, QA departments, and organizations seeking crash diagnostics alongside user experience monitoring.
5. Backtrace
Short Description
Backtrace is a crash reporting and debugging platform designed for applications that require detailed error diagnostics.
It is particularly relevant to native applications, games, and software environments where failures may involve compiled code, complex memory behavior, or platform-specific conditions.
Backtrace helps engineering teams collect crash information, group related failures, and analyze diagnostic artifacts.
For example, a game developer may need to investigate a crash affecting a particular graphics configuration or application build.
The platform’s focus on detailed crash analysis can be valuable when ordinary exception reporting does not provide sufficient information.
Backtrace is especially useful for technically demanding applications where reproducing failures is expensive or difficult.
Key Features
- Crash Collection: Captures supported application failures.
- Native Crash Diagnostics: Supports investigation of crashes in native software environments.
- Crash Grouping: Organizes related failure reports.
- Stack Trace Analysis: Helps identify code paths associated with crashes.
- Symbolication Support: Converts supported diagnostic addresses into readable code information.
- Diagnostic Metadata: Adds build, environment, and application context.
- Release Analysis: Helps compare failures across software versions.
- Issue Prioritization: Supports identifying recurring or widespread failures.
- Development Integrations: Connects crash information with engineering workflows.
Benefits
Backtrace provides detailed diagnostics for applications with complex failure modes.
It can reduce the effort required to investigate native crashes and build-specific problems.
Its grouping and analysis capabilities are useful when engineering teams receive large numbers of similar reports.
Pros
- Strong native crash analysis.
- Useful for gaming and complex software.
- Detailed diagnostic information.
- Crash grouping.
- Build and release context.
- Suitable for demanding debugging workflows.
Cons
- May be excessive for simple web applications.
- Integration can require specialized knowledge.
- Commercial terms need evaluation.
- Native symbol management requires operational discipline.
- Teams may need additional tools for infrastructure monitoring.
Use Cases
Game development: Engineers can investigate crashes associated with specific builds or hardware configurations.
Native applications: Teams can analyze failures involving compiled code.
Complex software products: Developers can prioritize recurring crash signatures.
Best For
Backtrace is suitable for game studios, native application developers, and engineering teams requiring detailed crash diagnostics.
6. Rollbar
Short Description
Rollbar is an error monitoring platform that helps developers detect exceptions, group related problems, and investigate failures across supported application environments.
It is commonly used for web applications and backend services, although its integration coverage extends to other supported technologies.
Rollbar emphasizes real-time error visibility and developer workflow integration.
For example, a SaaS platform may use Rollbar to detect a new exception introduced during a backend deployment.
The platform can group similar errors, provide diagnostic context, and notify the responsible engineering team.
Rollbar is particularly useful for organizations that want structured error monitoring without implementing a complete observability platform.
Key Features
- Real-Time Error Monitoring: Collects supported application errors as they occur.
- Exception Grouping: Combines related failures into manageable issues.
- Stack Trace Analysis: Provides code-level diagnostic information.
- Deployment Tracking: Helps associate errors with application releases.
- Alert Configuration: Notifies teams about important error conditions.
- Custom Metadata: Adds selected application context.
- Issue Workflow Integration: Connects errors with development tracking tools.
- Error Occurrence Analysis: Helps teams understand recurrence patterns.
- Supported SDKs: Provides integration options for multiple programming environments.
Benefits
Rollbar helps developers discover errors quickly and maintain visibility into recurring failures.
Its issue grouping reduces duplicate investigation work.
Deployment context also helps teams identify errors associated with recent code changes.
Pros
- Developer-focused error monitoring.
- Real-time error visibility.
- Useful exception grouping.
- Deployment-related context.
- Issue tracker integrations.
- Suitable for web and backend applications.
Cons
- Less specialized in native mobile crash diagnostics.
- Event volume may influence costs.
- Alert rules require maintenance.
- Advanced observability needs may require other tools.
- Error grouping quality depends on configuration.
Use Cases
Backend monitoring: Teams can identify exceptions in API services.
Web application debugging: Developers can investigate production errors.
Release monitoring: Organizations can detect regressions after deployments.
Best For
Rollbar is appropriate for web developers, backend engineers, and SaaS teams needing focused error monitoring.
7. Raygun
Short Description
Raygun is an application monitoring platform that provides crash reporting, real user monitoring, and application performance capabilities.
Its crash reporting functionality helps teams collect errors and investigate their impact across supported technologies.
Raygun is useful for organizations that want to examine application failures alongside broader user experience and performance information.
For example, an online service may discover that a particular error occurs during slow page loads or affects users on certain devices.
The platform can help teams investigate these issues through connected diagnostic and monitoring workflows.
Raygun is particularly relevant to organizations seeking application-focused monitoring rather than infrastructure-only telemetry.
Key Features
- Crash Reporting: Collects supported application errors.
- Error Grouping: Organizes similar failures.
- Stack Trace Diagnostics: Helps identify failing code paths.
- Affected User Analysis: Provides context about error impact.
- Release Monitoring: Associates errors with software versions.
- Real User Monitoring: Measures selected user experience characteristics.
- Application Performance Monitoring: Provides related performance visibility.
- Alerting: Notifies teams about important failures.
- Development Integrations: Connects findings with engineering workflows.
Benefits
Raygun connects error diagnostics with application experience monitoring.
This can help teams understand whether failures are isolated technical events or part of broader performance problems.
Its application-focused reporting also supports collaboration between development and product teams.
Pros
- Crash reporting and performance capabilities.
- Real user monitoring.
- Useful diagnostic context.
- Release tracking.
- Cross-technology support.
- Application experience focus.
Cons
- Multiple monitoring products may affect overall costs.
- Advanced configuration requires planning.
- Some teams may prefer specialized error-only tools.
- Not a complete infrastructure monitoring platform.
- Data collection requires privacy controls.
Use Cases
Web application quality: Teams can investigate errors and user experience problems.
SaaS monitoring: Organizations can track failures affecting customer workflows.
Release validation: Engineers can compare application behavior across deployments.
Best For
Raygun is suitable for web and application development teams wanting crash reporting with related performance monitoring.
8. Datadog Error Tracking
Short Description
Datadog Error Tracking is part of Datadog’s broader observability platform.
It helps organizations identify, group, and investigate application errors using telemetry collected through supported Datadog products.
Datadog is particularly relevant to engineering teams already using its infrastructure monitoring, application performance monitoring, logs, or real user monitoring capabilities.
For example, a microservices application may experience errors caused by a failing downstream service. Datadog can help engineers examine error information alongside traces, service performance, and infrastructure metrics.
This connected approach is valuable when application failures have causes beyond a single codebase.
However, Datadog’s broader platform requires careful configuration and cost management.
Key Features
- Error Grouping: Organizes related application errors.
- APM Integration: Connects errors with supported application traces.
- Real User Monitoring Integration: Provides frontend error context where configured.
- Service Context: Associates failures with monitored application services.
- Deployment Visibility: Helps correlate errors with releases.
- Alerting: Supports notifications based on monitored conditions.
- Log Correlation: Connects errors with relevant logs when configured.
- Dashboards: Presents error trends alongside other telemetry.
- Workflow Integrations: Connects monitoring findings with incident management processes.
Benefits
Datadog helps teams investigate errors within a broader operational context.
This can be especially useful when failures involve multiple services, infrastructure dependencies, or performance bottlenecks.
Organizations already using Datadog may reduce tool fragmentation by adding error tracking to existing workflows.
Pros
- Strong observability integration.
- Error and trace correlation.
- Useful for distributed applications.
- Centralized operational dashboards.
- Broad monitoring ecosystem.
- Enterprise incident workflow support.
Cons
- Pricing can become complex.
- Requires appropriate telemetry instrumentation.
- May be excessive for small applications.
- Broad functionality introduces a learning curve.
- Data volume needs active management.
Use Cases
Microservices debugging: Teams can investigate errors across distributed services.
Enterprise incident response: Engineers can correlate failures with infrastructure conditions.
Full-stack monitoring: Organizations can connect frontend and backend error information.
Best For
Datadog Error Tracking is appropriate for enterprise engineering teams and organizations already using Datadog observability.
9. New Relic Errors Inbox
Short Description
New Relic Errors Inbox provides error investigation and management capabilities within the New Relic observability platform.
It helps teams organize application errors and connect them with relevant performance and operational information.
New Relic is particularly useful for organizations monitoring applications across multiple services and technology stacks.
For example, a customer-facing application may experience a recurring API exception. Engineers can investigate the error alongside application transactions and related telemetry.
Errors Inbox supports structured investigation and collaboration, helping teams manage errors as operational issues rather than isolated log entries.
Its value is greatest when organizations already collect relevant application telemetry through New Relic.
Key Features
- Error Grouping: Organizes related application failures.
- Error Investigation: Provides diagnostic context for supported errors.
- APM Integration: Connects failures with application performance information.
- Service Monitoring: Associates errors with monitored services.
- Error Trends: Helps identify recurring or increasing failures.
- Issue Management: Supports structured investigation workflows.
- Alerting Integration: Connects error conditions with operational notifications.
- Telemetry Correlation: Links errors with related observability data.
- Cross-Service Visibility: Supports investigation across instrumented applications.
Benefits
New Relic helps organizations investigate errors within the broader context of application operations.
Its integrated telemetry can reduce the need to switch between disconnected monitoring systems.
Teams can also prioritize recurring errors and coordinate remediation work.
Pros
- Integrated observability platform.
- Useful application error context.
- Error grouping and investigation.
- Cross-service visibility.
- Operational workflow support.
- Suitable for enterprise applications.
Cons
- Requires appropriate New Relic instrumentation.
- Consumption-based costs need monitoring.
- Less focused on standalone mobile crash reporting.
- Platform complexity can be substantial.
- Teams may need additional mobile-specific diagnostics.
Use Cases
Enterprise application monitoring: Teams can investigate errors across services.
Backend incident response: Engineers can connect exceptions with application performance.
Operational reliability: Organizations can monitor recurring failures and remediation progress.
Best For
New Relic Errors Inbox is suitable for DevOps teams, SREs, and enterprises using New Relic for application observability.
10. Embrace
Short Description
Embrace is a mobile observability platform focused on understanding application reliability and performance from the user’s device.
It provides mobile-focused diagnostic information that can help engineering teams investigate crashes, application terminations, and related reliability problems.
Mobile failures can be difficult to diagnose because device conditions, network behavior, operating system restrictions, and application lifecycle events vary widely.
Embrace addresses these challenges through mobile telemetry and session-oriented diagnostic context.
For example, a streaming application may experience failures only on selected device models or during particular network transitions.
Embrace can help teams investigate the associated mobile behavior rather than relying exclusively on isolated crash reports.
Its mobile specialization makes it relevant to organizations with large or technically demanding mobile applications.
Key Features
- Mobile Crash Monitoring: Captures supported application crashes.
- Application Exit Visibility: Provides insight into certain abnormal termination conditions.
- Session-Based Diagnostics: Associates telemetry with mobile application sessions.
- Mobile Performance Monitoring: Tracks selected performance characteristics.
- Network Visibility: Helps investigate supported mobile network operations.
- Device Context: Provides relevant device and operating system information.
- Release Analysis: Helps compare application behavior across versions.
- Observability Integrations: Connects mobile telemetry with supported external monitoring systems.
- Mobile SDKs: Integrates with supported native and cross-platform application environments.
Benefits
Embrace provides mobile-specific diagnostic context that can be difficult to obtain from general-purpose monitoring tools.
It helps teams investigate failures associated with device behavior, application lifecycle changes, and network conditions.
This can improve troubleshooting for complex consumer mobile applications.
Pros
- Strong mobile observability focus.
- Crash and abnormal exit analysis.
- Session-oriented diagnostics.
- Network and performance context.
- Useful device-level information.
- Supports mobile reliability workflows.
Cons
- Less relevant to backend-only applications.
- Commercial pricing requires evaluation.
- SDK instrumentation must be planned carefully.
- Advanced observability capabilities require technical expertise.
- Privacy controls are important for session-related telemetry.
Use Cases
Streaming applications: Teams can investigate failures associated with playback and network changes.
Large mobile products: Engineers can monitor reliability across diverse devices.
Mobile incident investigation: Teams can connect crashes with surrounding session behavior.
Best For
Embrace is suitable for mobile engineering teams and organizations requiring detailed mobile reliability and observability data.
Comparison Table: Top 10 Crash Reporting Tools
| Tool | Best For | Supported Platforms | Standout Feature | Pricing Model |
|---|---|---|---|---|
| Firebase Crashlytics | Mobile developers | Android, Apple platforms, supported frameworks | Mobile crash grouping | Core service free |
| Sentry | Full-stack applications | Web, backend, mobile, desktop | Detailed cross-platform error context | Free and paid usage tiers |
| Bugsnag | Application stability teams | Mobile, web, backend | Stability prioritization | Commercial plans |
| Instabug | Mobile QA teams | Mobile applications | Crash diagnostics and user experience context | Commercial plans |
| Backtrace | Native apps and games | Supported native and game environments | Detailed native crash analysis | Commercial pricing |
| Rollbar | Web and backend developers | Web, backend, supported SDKs | Real-time exception tracking | Free and paid tiers |
| Raygun | Application monitoring teams | Web, mobile, backend | Crash and user experience monitoring | Subscription pricing |
| Datadog Error Tracking | Enterprise observability | Instrumented applications and services | Error and trace correlation | Usage/product-based |
| New Relic Errors Inbox | DevOps and SRE teams | Instrumented applications and services | Integrated error investigation | Consumption-based |
| Embrace | Mobile observability teams | Supported mobile platforms | Session-oriented mobile diagnostics | Commercial pricing |
Which Crash Reporting Tool Is Right for You?
For Mobile Application Development
Firebase Crashlytics is a practical starting point for many Android and iOS applications.
Bugsnag and Instabug deserve consideration when teams need additional stability analysis or mobile experience context.
Embrace is particularly relevant to organizations requiring deeper mobile observability.
For Full-Stack Applications
Sentry and Rollbar are useful for teams monitoring frontend and backend exceptions.
Sentry provides broad monitoring capabilities, while Rollbar emphasizes focused error investigation.
For Native Software and Games
Backtrace is relevant when developers need detailed native crash diagnostics and symbolication.
For Enterprise Observability
Datadog and New Relic are appropriate when crash investigation must connect with distributed traces, logs, service metrics, and incident workflows.
Important Selection Criteria
Evaluate SDK compatibility, crash capture reliability, stack trace quality, symbolication, error grouping, alerting, privacy controls, integrations, and total cost.
Also test whether the platform can capture the failure types that matter most to your application.
Best Crash Reporting Tools for Different Users
| User Type | Recommended Tool | Reason |
|---|---|---|
| Android developer | Firebase Crashlytics | Integrated mobile crash reporting |
| Full-stack developer | Sentry | Broad error tracking support |
| Mobile stability team | Bugsnag | Stability-focused issue analysis |
| Mobile QA engineer | Instabug | Diagnostics and experience context |
| Game developer | Backtrace | Native crash analysis |
| Backend developer | Rollbar | Focused exception monitoring |
| Web application team | Raygun | Crash and user experience monitoring |
| Enterprise SRE | Datadog | Connected observability |
| DevOps engineer | New Relic | Integrated error investigation |
| Mobile reliability engineer | Embrace | Detailed mobile session diagnostics |
Practical Example: Investigating a Mobile Application Crash
Consider a retail application that begins crashing during checkout after a new release.
Step 1: Detect the Stability Regression
The monitoring dashboard shows an increase in crashes associated with the latest application version.
Step 2: Identify the Affected Population
Engineers examine affected operating system versions, devices, and application releases.
Step 3: Inspect the Stack Trace
The crash report identifies an exception in the checkout workflow.
The team examines the relevant code path and associated diagnostic information.
Step 4: Review Recent Changes
Developers compare the failing release with the previous stable version.
They identify changes involving payment response handling.
Step 5: Reproduce the Failure
QA engineers reproduce the issue using representative test data and device configurations.
Step 6: Determine the Root Cause
The team discovers that an optional payment response field is being accessed without validating whether it exists.
Step 7: Implement the Fix
Developers add appropriate validation and error handling.
Step 8: Test the Correction
Automated and manual tests confirm that the checkout workflow handles the missing field safely.
Step 9: Release Gradually
The organization deploys the fix through a controlled rollout where supported.
Step 10: Verify Stability
Engineers monitor crash-free sessions, affected-user metrics, and checkout completion.
They confirm that the original failure no longer occurs at the previous rate and watch for unintended regressions.
Frequently Asked Questions (FAQs)
1. What is a crash reporting tool?
A crash reporting tool collects diagnostic information about unexpected application failures and helps developers investigate them.
2. What is a stack trace?
A stack trace records the sequence of function calls associated with an error. It helps developers locate the code path involved in a failure.
3. What is the difference between crash reporting and error monitoring?
Crash reporting focuses on failures that terminate or seriously disrupt an application. Error monitoring also includes handled exceptions and other nonfatal problems.
4. Can crash reporting tools detect every application failure?
No. Some failures may prevent data collection or upload, and certain operating system terminations may not generate conventional crash reports.
5. Which crash reporting tool is best for Android?
Firebase Crashlytics is a common choice because of its Android integration. Sentry, Bugsnag, and other tools may be more appropriate for particular diagnostic requirements.
6. Can crash reporting tools monitor iOS applications?
Yes. Several platforms provide Apple application SDKs and support relevant crash diagnostics.
7. What is symbolication?
Symbolication converts supported memory addresses or compiled diagnostic information into readable function names and source references.
8. Why are crash-free users and crash-free sessions different?
Crash-free users measure the proportion of users without recorded crashes. Crash-free sessions measure the proportion of application sessions without recorded crashes.
The metrics answer different reliability questions.
9. Can crash reports contain personal information?
Yes. Logs, custom metadata, and diagnostic context can unintentionally include sensitive information.
Teams should apply data filtering and privacy controls.
10. How should crashes be prioritized?
Consider affected users, frequency, business impact, severity, reproducibility, and whether the problem blocks critical workflows.
11. Are free crash reporting tools sufficient?
They may be sufficient for smaller applications. Larger organizations may require advanced retention, integrations, support, and observability features.
12. What are breadcrumbs?
Breadcrumbs are selected events recorded before an error. They provide context about application activity leading up to the failure.
13. Can crash reporting replace application testing?
No. Crash reporting identifies problems occurring in monitored environments, while testing helps prevent defects before release.
14. How do teams reduce duplicate crash reports?
Error grouping combines failures with similar characteristics. Teams should review grouping rules because unrelated failures can occasionally be grouped together.
15. How often should crash reports be reviewed?
Critical alerts should be investigated promptly. Teams should also review stability trends during release planning and regular engineering quality meetings.
Final Thoughts
Crash reporting tools are essential for maintaining dependable software.
Firebase Crashlytics provides accessible mobile crash monitoring, while Sentry and Rollbar support broader developer-oriented error tracking.
Bugsnag and Instabug focus on application stability and mobile quality, while Backtrace supports demanding native debugging requirements.
Raygun combines crash diagnostics with application experience monitoring. Datadog and New Relic connect errors with broader observability data, and Embrace provides specialized mobile reliability insights.
The best crash reporting platform is one that helps engineering teams identify important failures, understand their causes, and verify that corrective changes improve application stability.