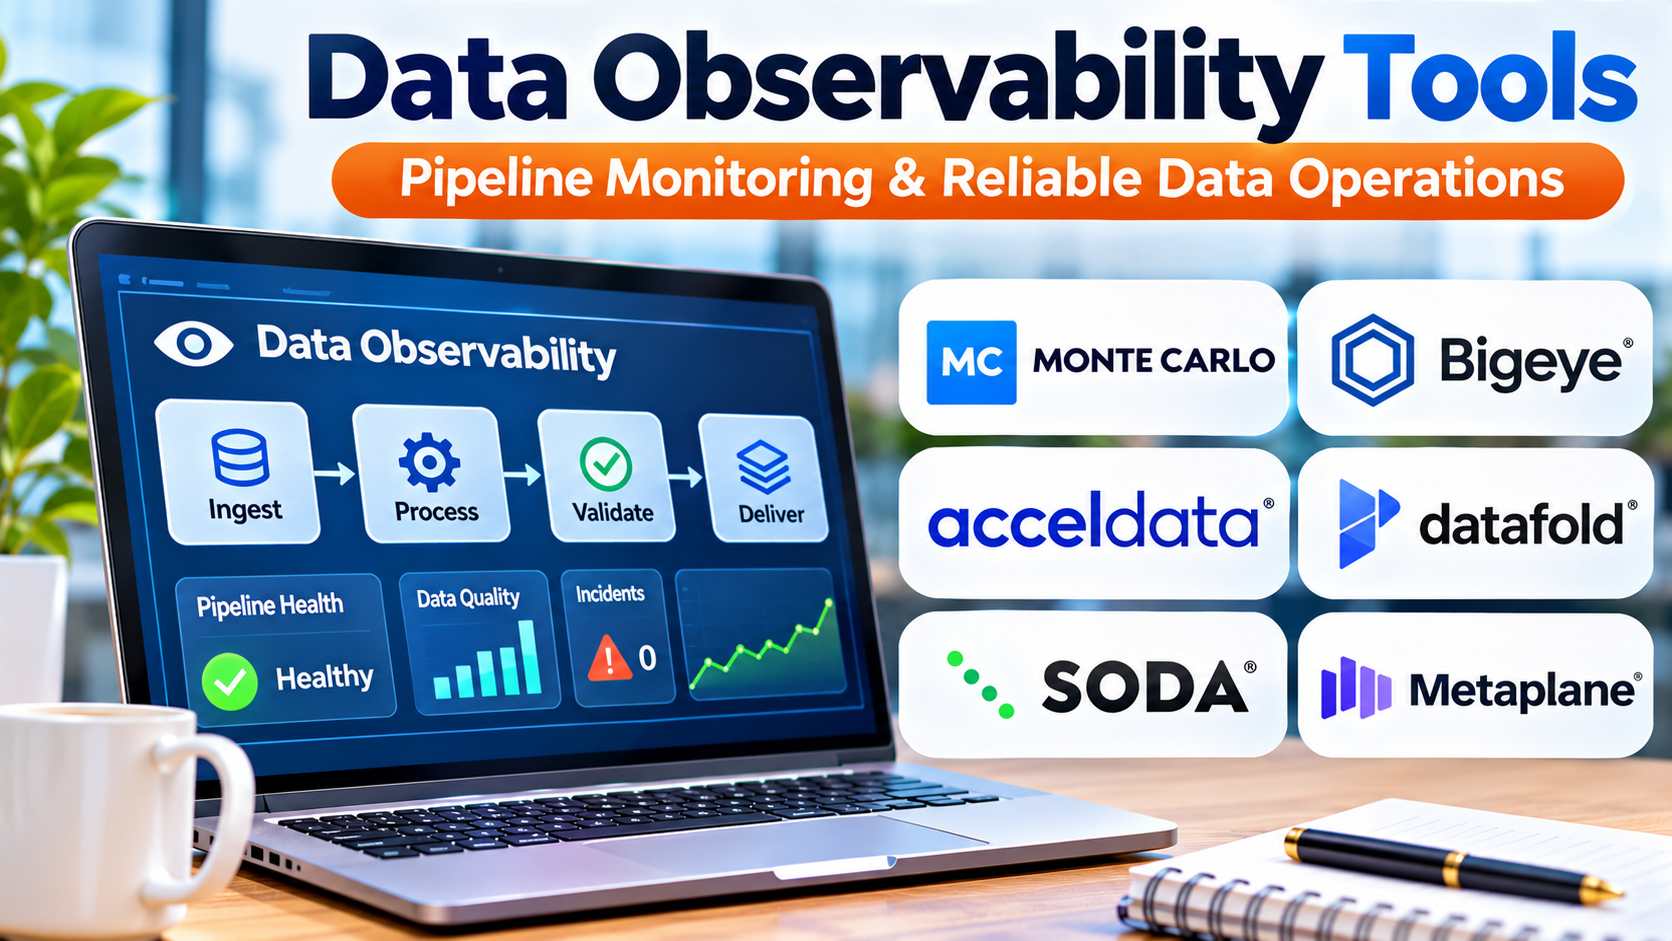
A company can have a healthy cloud infrastructure and still deliver unreliable data.
A pipeline may finish successfully while producing incomplete records. A database table may receive fewer transactions than expected. A dashboard may display outdated information without showing any technical error.
These failures are especially difficult because traditional application monitoring may not detect them.
Data observability tools help organizations understand whether information is arriving, changing, and behaving as expected throughout their data environment.
They provide visibility into data health, pipeline dependencies, unexpected changes, and potential failures.
However, effective observability requires more than installing monitoring software. Organizations must understand which datasets matter, what normal behavior looks like, and who should respond when something goes wrong.
What Are Data Observability Tools?
Data observability tools are software platforms that monitor the health and reliability of data systems.
They help teams detect unexpected behavior in datasets, pipelines, and analytical environments.
Common monitoring areas include:
- Data freshness
- Data volume
- Schema changes
- Data distributions
- Pipeline execution
- Data quality signals
- Dataset dependencies
- Unexpected anomalies
Consider an online retailer that normally receives thousands of orders every day.
One morning, its warehouse contains only a small fraction of the expected records.
The ingestion pipeline reports a successful execution, but the underlying data is incomplete.
A data observability platform may identify the unusual drop in record volume and alert the responsible team.
The alert does not necessarily reveal the root cause immediately. It provides an early signal that something requires investigation.
Why Traditional Monitoring Is Not Enough
Infrastructure monitoring focuses on the health of technical resources.
It can reveal server failures, high memory usage, application errors, or network problems.
Data monitoring examines whether the information flowing through those resources is reliable.
A database can remain available while storing incorrect values.
A transformation job can finish without errors while excluding important records.
A dashboard can load quickly while displaying information from several days earlier.
These situations demonstrate why technical availability and data reliability must be evaluated separately.
Data observability complements infrastructure and application monitoring rather than replacing them.
The Core Dimensions of Data Observability
Different vendors organize observability capabilities differently, but several dimensions appear frequently.
Data freshness
Freshness measures whether information has been updated within an acceptable period.
For example, a daily sales report may require data from the previous business day.
A real-time fraud monitoring application may require much faster updates.
Freshness expectations should reflect business needs.
Data volume
Volume monitoring examines how much information enters or leaves a system.
An unexpected decrease in transaction records may indicate missing data.
A sudden increase may indicate duplicate ingestion, an application change, or legitimate business growth.
Volume anomalies require context before they can be classified as failures.
Schema monitoring
Schemas define the structure of datasets.
A source application may rename a column, change a data type, or remove a field.
These changes can affect downstream transformations and reports.
Schema monitoring helps teams detect structural changes and investigate their consequences.
Data distribution
Distribution monitoring examines patterns within values.
For example, a customer age field may suddenly contain unusually high numbers.
A payment status column may begin showing unexpected categories.
Distribution changes can reveal errors, but they may also reflect genuine business changes.
Data lineage
Lineage shows relationships between upstream and downstream assets.
When an issue appears in one dataset, lineage can help identify potentially affected reports and transformations.
The accuracy of this analysis depends on the completeness of the lineage information.
How Data Observability Tools Work
A typical observability workflow contains several stages.
1. Connect to data systems
The platform connects to supported warehouses, databases, processing tools, or orchestration systems.
It may collect metadata, query selected datasets, or receive operational events.
2. Establish expectations
Some platforms use predefined rules.
Others analyze historical behavior to identify patterns.
For example, a platform may learn that a table normally receives new records every hour.
Historical patterns can be useful, but they do not automatically establish what is correct.
3. Monitor data behavior
The system evaluates selected signals over time.
These may include row counts, update timestamps, null rates, schema changes, and statistical distributions.
4. Detect anomalies
The platform identifies behavior that differs from configured expectations or learned patterns.
An anomaly is a signal requiring interpretation, not automatic proof of incorrect data.
5. Notify responsible teams
Alerts may be sent through supported incident management or collaboration systems.
Useful alerts explain which asset is affected, what changed, and when the problem began.
6. Support investigation
Teams examine historical signals, lineage, pipeline logs, and source systems to identify the cause.
The platform may help narrow the investigation, but remediation often requires action in another system.
Data Observability Tools Worth Evaluating
The market includes dedicated data observability platforms and broader data reliability products.
| Platform | Primary evaluation angle |
|---|---|
| Monte Carlo | Automated data monitoring, anomaly detection, and lineage |
| Bigeye | Data quality monitoring and observability workflows |
| Acceldata | Data observability across data and processing environments |
| Soda | Data quality checks, monitoring, and issue detection |
| Databand | Pipeline-oriented data observability |
| Metaplane | Automated monitoring of analytical data |
| Anomalo | Automated detection of data quality anomalies |
These products should not be treated as interchangeable.
Some emphasize warehouse monitoring. Others focus on pipeline operations, quality checks, or broader infrastructure relationships.
Monte Carlo
Monte Carlo is associated with automated data observability.
It is relevant to organizations that want to monitor analytical datasets and investigate unexpected changes.
Evaluation should focus on supported data sources, alert quality, lineage coverage, and the effort required to maintain monitoring.
Bigeye
Bigeye focuses on monitoring data quality and reliability.
It may be relevant when organizations need visibility into data behavior and structured approaches to managing data quality issues.
Buyers should examine metric configuration, anomaly detection, alert management, and integration coverage.
Acceldata
Acceldata addresses data observability across complex data environments.
It is relevant to organizations that need visibility into data processing and reliability across multiple technologies.
Evaluation should consider whether the platform covers the organization’s actual infrastructure and analytical systems.
Soda
Soda provides tools for defining and monitoring data quality checks.
It is relevant to teams that want explicit rules alongside monitoring workflows.
A useful evaluation should examine how checks are maintained, how failures are reported, and how the platform fits engineering processes.
Databand
Databand focuses on data pipeline observability.
It may be relevant when operational failures, unexpected pipeline behavior, and execution visibility are central concerns.
Organizations should confirm current product availability, supported integrations, and deployment options.
Metaplane
Metaplane is associated with automated data monitoring.
It is relevant to analytical teams seeking anomaly detection and visibility into changes affecting warehouse data.
Buyers should confirm current product packaging and integration support before making a selection.
Anomalo
Anomalo focuses on detecting unexpected data quality behavior.
It may be useful for organizations managing large datasets where manually defining every possible quality rule is impractical.
Evaluation should consider false alerts, explainability, data access requirements, and the ability to investigate detected anomalies.
How to Choose the Right Data Observability Tool
The most useful selection process begins with a specific reliability problem.
Identify critical datasets
Not every dataset requires the same monitoring depth.
Start with information that supports revenue reporting, customer operations, regulatory obligations, or important automated decisions.
Define reliability expectations
Determine acceptable freshness, completeness, and error thresholds.
For example, a daily financial report may require all expected transactions before publication.
A product analytics dashboard may tolerate a short processing delay.
Evaluate anomaly detection
Automated anomaly detection can reduce the need to define every monitoring rule manually.
However, it can also generate false positives.
Test how the platform handles seasonal changes, unusual business events, and expected fluctuations.
Examine lineage coverage
When an issue appears, teams need to understand its potential impact.
Check whether the platform can identify relevant downstream datasets and reports.
Review alert management
Too many alerts can overwhelm engineering teams.
A useful platform should help prioritize incidents and provide enough context for investigation.
Understand monitoring costs
Observability may require additional warehouse queries, metadata collection, processing, and storage.
Evaluate how monitoring frequency and dataset size affect costs.
Assess security
The platform may need access to sensitive schemas or data values.
Review permissions, encryption, retention, and whether monitoring can operate with limited access.
Data Observability vs. Data Quality
Data quality and data observability overlap, but they emphasize different questions.
Data quality asks whether information satisfies defined requirements.
Data observability asks whether data systems are behaving reliably and whether unexpected changes are occurring.
For example, a quality rule may require every completed order to contain a customer identifier.
An observability monitor may detect that the order table stopped receiving new records.
Many modern products support both approaches.
Organizations should evaluate capabilities rather than relying only on category labels.
Data Observability vs. Application Observability
Application observability typically uses metrics, logs, and traces to investigate software behavior.
Data observability focuses on information flowing through data systems.
An application can operate normally while producing incorrect analytical data.
Likewise, a data pipeline can process valid records while experiencing an infrastructure performance issue.
Combining the two forms of monitoring can improve incident investigations.
Building a Data Observability Program
Begin with business-critical information
Choose a small number of important datasets.
Document their purpose, owner, update schedule, and downstream consumers.
Establish baseline behavior
Review historical patterns and identify acceptable variation.
Avoid assuming that every historical pattern represents correct behavior.
Configure essential monitoring
Start with freshness, volume, schema, and important quality checks.
Add more complex monitoring only when it provides useful information.
Define incident ownership
Every alert should have a responsible team.
Establish how issues are acknowledged, investigated, and resolved.
Connect monitoring to change management
When pipelines or schemas change, review whether monitoring rules need updates.
Measure reliability
Track incident frequency, detection time, resolution time, and recurring causes.
These indicators help determine whether observability is improving operational outcomes.
Common Data Observability Mistakes
One mistake is monitoring every dataset with equal intensity.
This can create excessive cost and alert volume.
Another mistake is relying entirely on automated anomaly detection.
Some business requirements need explicit rules that should never be learned from historical behavior alone.
Organizations also sometimes treat every anomaly as an incident.
Unexpected behavior may result from legitimate changes in customer activity or business operations.
Finally, monitoring without clear ownership provides limited value.
An alert that nobody investigates does not improve reliability.
Frequently Asked Questions
What is the main purpose of data observability tools?
They help teams detect and investigate unexpected changes that may affect the reliability of data systems.
Can data observability prevent every data error?
No. It improves visibility and detection, but some errors may remain undetected or require separate validation controls.
Does data observability replace data quality testing?
Not necessarily. Explicit quality tests remain useful for enforcing known business rules.
Is data observability necessary for small organizations?
It depends on the complexity and importance of their data pipelines. Smaller teams may begin with basic checks and pipeline monitoring.
What is the difference between a data anomaly and a data error?
An anomaly is unexpected behavior. An error is behavior or information that violates an established requirement.
Final Thoughts
Data observability tools help organizations recognize data problems before those problems spread into reports, applications, and business decisions.
Their value comes from early detection, useful context, and faster investigation.
The strongest approach combines monitoring technology with clear reliability expectations, accurate lineage, and responsible incident ownership.
Start with critical datasets, measure real improvements, and expand monitoring where it reduces meaningful business risk.