A marketing manager wants to understand why campaign conversions declined. A sales director needs to compare regional performance. A customer success team wants to identify accounts showing lower engagement.
These questions may appear simple, but answering them can involve several systems, complicated calculations, and repeated requests to data analysts.
Traditional reporting workflows often create a queue. Business teams submit requests, analysts prepare reports, and decision-makers wait for results.
Self-service analytics tools aim to reduce this dependency.
They allow authorized employees to explore information, create reports, and investigate business questions without requiring technical specialists to build every analysis.
However, making analytics accessible is not the same as making every analysis trustworthy. Successful self-service analytics requires reliable data, shared definitions, suitable permissions, and tools that match the skills of their users.
What Are Self-Service Analytics Tools?
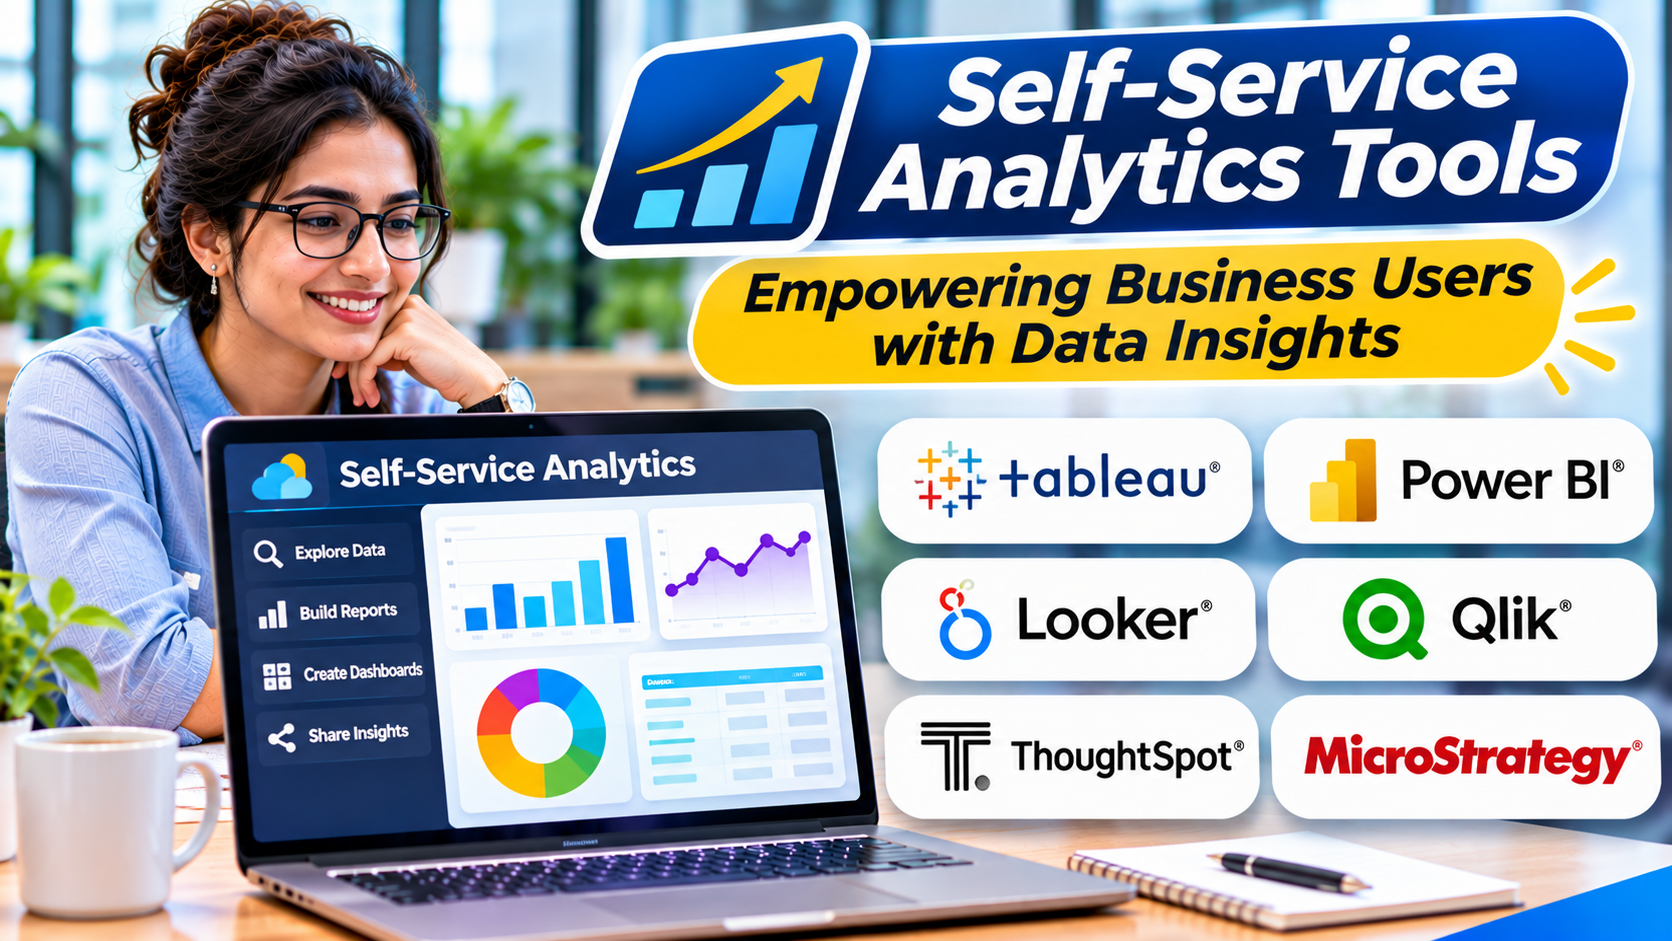
Self-service analytics tools are software applications that help business users access, explore, and analyze data with limited technical assistance.
They commonly provide graphical interfaces, interactive dashboards, guided exploration, and reusable analytical models.
Some platforms also support natural-language questions, allowing users to describe an analytical request in ordinary language.
For example, a regional sales manager might want to compare monthly revenue across territories.
Instead of writing SQL queries, the manager could select a revenue metric, choose a region dimension, and create a chart.
The platform retrieves or processes the relevant information and presents the results.
The important condition is that the underlying data and metric definitions must be reliable.
An easy-to-use interface cannot compensate for inaccurate information.
How Self-Service Analytics Works
A typical self-service analytics environment contains several connected components.
Data connections
The platform connects to databases, cloud data warehouses, spreadsheets, or business applications.
Some products import information into an internal analytical model.
Others query external systems directly.
The architecture affects performance, freshness, governance, and cost.
Data preparation
Raw information often needs cleaning, transformation, and modeling before employees can use it confidently.
For example, a customer database may contain several records for the same account.
A sales dataset may use inconsistent currency formats.
Data preparation helps establish usable analytical information.
Semantic modeling
A semantic model defines business metrics and relationships in terms employees understand.
For example, it may define net revenue as gross sales minus eligible discounts and returns.
A shared model reduces the risk that different departments calculate the same indicator differently.
Interactive exploration
Users investigate information through filters, charts, tables, and drill-down features.
They may compare periods, examine customer groups, or investigate unexpected changes.
Sharing and collaboration
Reports and dashboards can be shared with authorized colleagues.
Depending on the platform, teams may also schedule reports, annotate findings, or embed analytics inside applications.
Why Businesses Need Self-Service Analytics
Faster access to answers
Employees can investigate routine questions without waiting for every request to reach a data specialist.
This can reduce reporting delays.
Reduced analyst workload
Data teams can spend less time creating repetitive reports.
They can focus on improving data models, investigating complex problems, and supporting advanced analysis.
Greater analytical participation
Employees who understand business processes can explore information directly.
For example, a customer success manager may recognize unusual account behavior that a central analytics team would not immediately notice.
More consistent reporting
When self-service tools use governed data models, teams can work with shared definitions.
This is preferable to maintaining separate spreadsheets with conflicting calculations.
Better decision support
Accessible analytics can help employees evaluate options using evidence.
However, faster access to data does not automatically produce better decisions.
Users still need analytical judgment and business context.
Essential Features of Self-Service Analytics Tools
Intuitive user interface
The platform should make common tasks understandable to nontechnical users.
Creating a chart, applying a filter, or changing a date range should not require extensive technical knowledge.
Governed metrics
Shared business definitions are essential.
Without them, different teams may create incompatible calculations for revenue, retention, or customer acquisition cost.
Natural-language exploration
Some tools allow users to ask questions using everyday language.
For example, a user might request sales by region for the previous quarter.
Natural-language features can improve accessibility, but generated queries and interpretations should be verified.
Ambiguous business terminology can produce misleading results.
Interactive dashboards
Dashboards help users monitor important metrics and investigate changes.
Useful features include filtering, drill-down navigation, and comparisons across dimensions.
Data access controls
Users should only see information appropriate to their responsibilities.
Row-level security, role-based permissions, and workspace controls may be important depending on the platform.
Collaboration
Teams may need to share reports, discuss findings, and maintain approved analytical content.
Performance
Self-service analytics should remain responsive under realistic workloads.
Slow queries and overloaded dashboards can discourage adoption.
Self-Service Analytics Tools Worth Evaluating
Several established platforms support self-service analytics, although their approaches differ.
| Platform | Primary evaluation angle |
|---|---|
| Microsoft Power BI | Governed reporting and business-user analytics |
| Tableau | Interactive visual exploration |
| Qlik Sense | Associative data exploration |
| ThoughtSpot | Search-driven analytical experiences |
| Looker | Governed metrics and modeled analytics |
| Sigma | Spreadsheet-style analysis on cloud data |
| Metabase | Accessible queries and dashboards |
| Zoho Analytics | Business reporting and guided analytics |
These products are not ranked. The right choice depends on the organization’s data architecture, governance needs, and user skills.
Microsoft Power BI
Power BI combines reporting, data modeling, and interactive analytics.
It is particularly relevant to organizations using Microsoft technologies.
Business users can explore approved reports while analysts and data specialists maintain underlying models.
Evaluation should focus on licensing, semantic modeling, permissions, refresh requirements, and the skills needed to maintain analytical content.
Tableau
Tableau emphasizes visual exploration.
It can be useful when employees need to investigate information through interactive charts and dashboards.
Organizations should assess whether their intended users can create meaningful analyses without excessive training.
Data preparation and governance requirements remain important.
Qlik Sense
Qlik Sense supports interactive analytical exploration through an associative approach.
This can help users investigate relationships across dimensions.
Buyers should evaluate its data modeling requirements, governance capabilities, and user experience with representative business questions.
ThoughtSpot
ThoughtSpot emphasizes search-oriented analytics.
It is relevant when organizations want business users to explore information through search and natural-language experiences.
The quality of results depends on how well the platform understands the underlying data model and business terminology.
Organizations should test ambiguous questions and validate generated answers.
Looker
Looker emphasizes governed analytical modeling.
Its approach may suit organizations that prioritize shared definitions and consistent metrics.
However, creating and maintaining models may require technical expertise.
The balance between centralized modeling and business-user independence should be examined carefully.
Sigma
Sigma offers a spreadsheet-like analytical experience connected to cloud data platforms.
It may appeal to employees who are comfortable working with spreadsheet-style interfaces.
Evaluation should consider supported data sources, governance, collaboration, and the performance implications of analytical queries.
Metabase
Metabase provides reporting and exploratory analytics with an accessible interface.
It can be relevant to smaller teams or organizations seeking straightforward analytical workflows.
Buyers should examine the capabilities available in the intended edition, including permissions, deployment, and governance.
Zoho Analytics
Zoho Analytics provides reporting and analytical capabilities for business users.
It may be relevant to organizations seeking dashboards and analytics connected to common business applications.
Evaluation should focus on integration coverage, data modeling, collaboration, and reporting requirements.
How to Choose the Right Self-Service Analytics Tool
The most important question is whether intended users can answer real business questions accurately.
Identify user skill levels
Some employees are comfortable with spreadsheets.
Others understand SQL or advanced analytical concepts.
A platform should match the audience rather than assume that every employee wants the same analytical experience.
Test realistic questions
Use actual business questions during evaluation.
For example:
- Which customer segments had the highest retention?
- Why did revenue decline in a particular region?
- Which products experienced the largest increase in returns?
Observe whether users can find correct answers without extensive technical help.
Evaluate data governance
Self-service analytics can create confusion when every employee defines metrics independently.
Look for shared models, approved datasets, permissions, and clear ownership.
Assess performance
Test realistic data volumes and concurrent usage.
A tool that works well with a demonstration dataset may struggle with complex production queries.
Review security
Confirm that employees cannot access restricted information through filters, exports, or shared reports.
Calculate total cost
Consider user licenses, data processing, warehouse queries, implementation, administration, and training.
The cheapest subscription may not produce the lowest operating cost.
Self-Service Analytics vs. Traditional BI
Traditional BI and self-service analytics overlap significantly.
Traditional BI often emphasizes centrally developed reports and controlled distribution.
Self-service analytics emphasizes allowing authorized users to explore information and answer additional questions independently.
Modern BI platforms frequently support both approaches.
The distinction is therefore more about operating models and user experience than completely separate software categories.
The Importance of a Semantic Layer
A semantic layer connects technical data structures with business concepts.
It allows employees to work with familiar terms such as revenue, customer, product, and region.
For example, a sales manager should not need to understand how several transaction tables are joined to calculate quarterly revenue.
A governed model can expose the approved metric.
This reduces inconsistent calculations and makes analytics easier to use.
However, the semantic layer must be maintained as business definitions change.
Implementing Self-Service Analytics Successfully
Start with a focused department
Choose a team with clear reporting needs and engaged users.
For example, a sales operations team may need recurring pipeline and revenue analysis.
Establish trusted datasets
Verify data quality and agree on important definitions.
Build reusable models
Create approved metrics and relationships that employees can use consistently.
Provide suitable training
Teach users how to apply filters, interpret results, and recognize analytical limitations.
Define permissions
Give employees appropriate access without exposing unnecessary sensitive information.
Monitor adoption
Evaluate whether users can answer questions independently and whether repeated reporting requests decrease.
Improve continuously
Collect feedback and refine data models, documentation, and workflows.
Common Self-Service Analytics Mistakes
One mistake is assuming that an intuitive interface eliminates the need for data literacy.
Employees still need to understand metrics, comparisons, and uncertainty.
Another mistake is allowing unrestricted access to poorly documented datasets.
This can create conflicting reports and unreliable decisions.
Organizations also sometimes overestimate natural-language analytics.
Generated answers may misunderstand ambiguous terms or apply incorrect filters.
Finally, teams may deploy software without assigning responsibility for analytical models.
When definitions change, nobody updates the shared reporting foundation.
Frequently Asked Questions
What is the main purpose of self-service analytics tools?
They help authorized business users explore and analyze information with less dependence on technical specialists.
Do self-service analytics tools eliminate the need for analysts?
No. Analysts remain important for data modeling, advanced analysis, validation, and interpretation.
Can employees use self-service analytics without SQL?
Many platforms provide graphical or natural-language interfaces, although advanced workflows may still require technical skills.
Is self-service analytics secure?
It can be when permissions, data governance, and sharing controls are configured appropriately.
What is the biggest implementation challenge?
A major challenge is balancing analytical independence with consistent definitions, reliable data, and appropriate governance.
Final Thoughts
Self-service analytics tools help organizations make business information more accessible.
Their greatest value comes from allowing employees to investigate useful questions while working with trusted data.
Successful adoption requires more than an easy interface.
Organizations need reliable models, clear permissions, appropriate training, and ongoing ownership.
Choose a platform that helps employees answer real questions accurately rather than simply producing more dashboards.