A delivery company needs to track vehicles as they move. An online retailer wants to understand customer activity during a major sale. A financial services provider needs to investigate unusual transaction patterns before they create additional risk.
In these situations, waiting until the next morning for an updated report may be too slow.
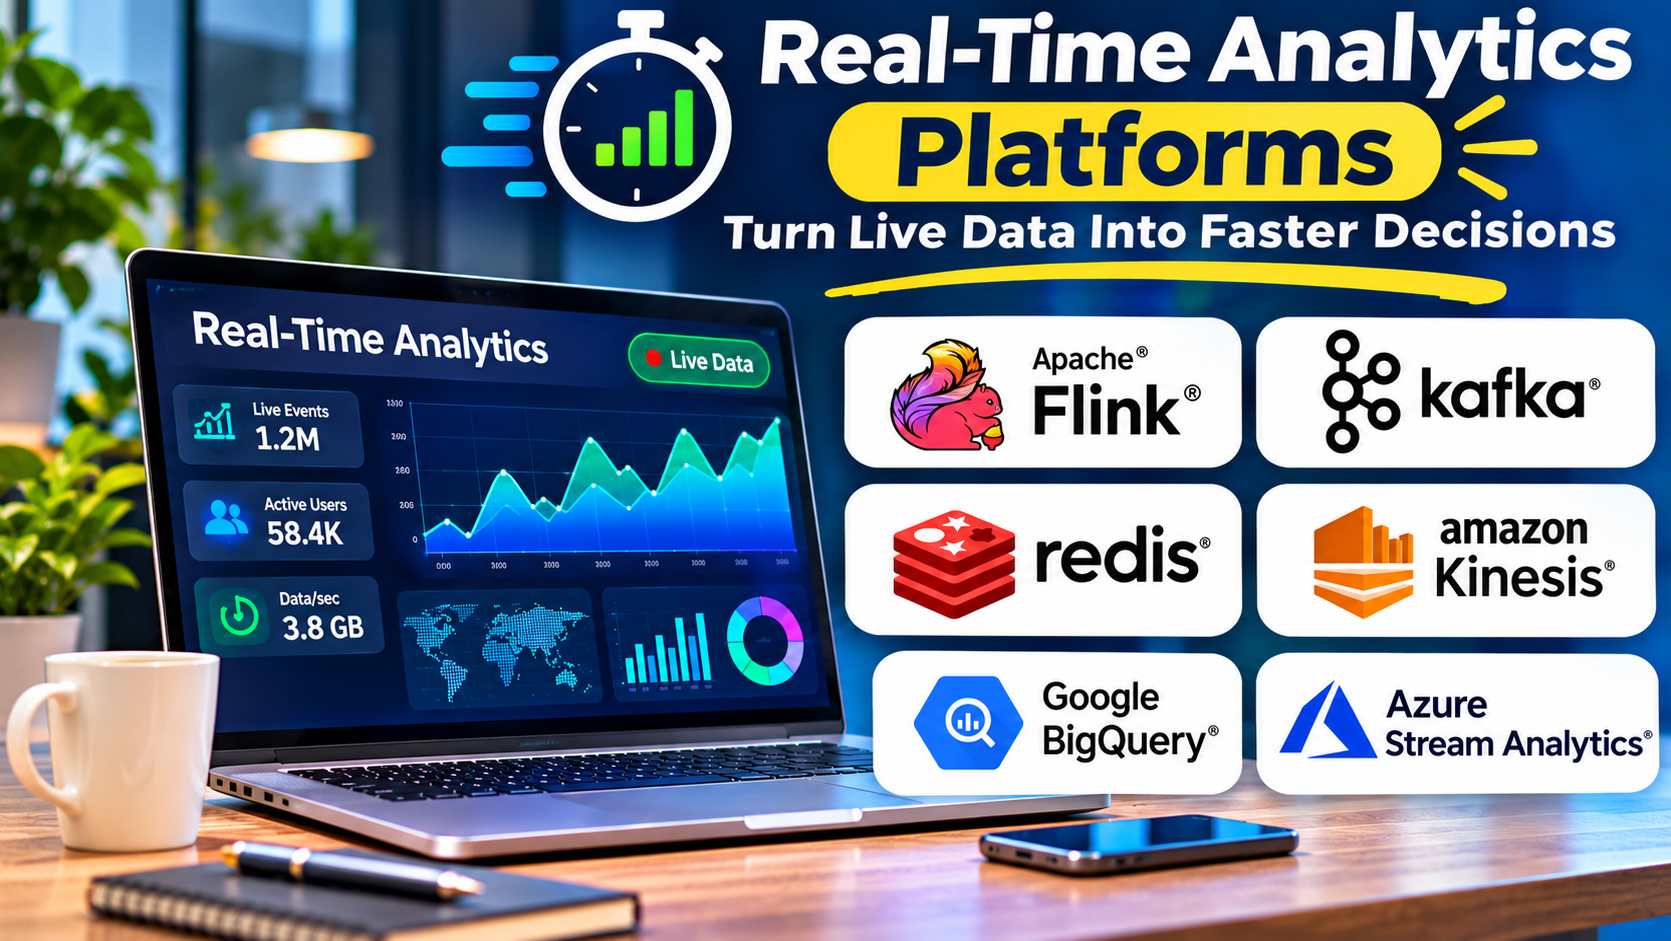
Real-time analytics platforms help organizations analyze information as it arrives or shortly afterward. They support operational dashboards, monitoring systems, event-driven applications, and decisions that depend on recent activity.
However, real-time analytics is not simply traditional reporting with a faster refresh button.
It introduces important architectural decisions involving ingestion, processing, storage, query performance, reliability, and operating cost.
The best platform is not necessarily the one promising the lowest possible latency. It is the one that delivers sufficiently fresh, trustworthy information for the intended business outcome.
What Are Real-time Analytics Platforms?
Real-time analytics platforms are software systems designed to process, query, and analyze recently generated information with low delay.
They commonly work with continuously arriving events, logs, transactions, application activity, or sensor measurements.
For example, an e-commerce application may generate an event whenever a customer views a product, adds an item to a cart, or completes a purchase.
A real-time analytics platform can help aggregate these events and display recent purchasing activity.
Business teams may use the results to monitor conversion rates, identify unusual changes, or investigate operational issues.
The exact meaning of real time depends on the application.
A manufacturing alert may require a response within milliseconds. A customer engagement dashboard may remain useful with several seconds of delay.
Organizations should define their actual latency requirements before choosing a technology.
How Real-time Analytics Works
A typical real-time analytics architecture contains several components.
1. Event generation
Applications and systems produce events representing activities or changes.
Examples include:
- Customer purchases
- Website interactions
- Application errors
- Payment transactions
- Sensor measurements
- Inventory updates
- Device status changes
Each event may contain an identifier, timestamp, event type, and relevant attributes.
2. Data ingestion
An ingestion layer receives information from source systems.
It may use event streaming platforms, message brokers, APIs, or direct connectors.
The ingestion architecture must handle the expected volume and variation in incoming traffic.
3. Stream processing
Some applications need to transform or aggregate events before analysis.
For example, a processing job might calculate the number of purchases during a rolling five-minute period.
Other workflows may enrich events with customer or product information.
Not every analytics platform performs all processing internally.
4. Analytical storage
The processed or raw events may be stored in a system optimized for analytical queries.
This allows applications to retrieve recent information without repeatedly scanning every historical event.
5. Query execution
Dashboards and applications query the analytical system.
A well-designed platform should support the required query patterns within acceptable latency.
6. Visualization and action
The results may appear in dashboards, alerts, operational applications, or automated decision workflows.
The value of the system depends on whether the information reaches the people or applications that need it.
Real-time Analytics vs. Batch Analytics
Batch analytics processes information in groups, often according to a schedule.
Real-time analytics focuses on making new information available with lower delay.
| Consideration | Real-time analytics | Batch analytics |
|---|---|---|
| Data availability | Continuously or frequently updated | Updated after scheduled processing |
| Typical use | Operational monitoring and time-sensitive analysis | Periodic reporting and historical analysis |
| Processing complexity | Often requires continuous operations | Often easier to schedule and control |
| Infrastructure | May require continuously running services | May use scheduled computing resources |
| Main priority | Timely results | Efficient, reliable processing of accumulated data |
Neither approach is universally superior.
Monthly financial reporting may not benefit from continuous event processing.
Fraud detection or live operational monitoring may require much faster access to information.
Many organizations combine both approaches.
Core Features of Real-time Analytics Platforms
Low-latency ingestion
The platform should receive new information within the time required by the application.
Test actual ingestion delays rather than relying only on advertised performance.
Fast analytical queries
Real-time analytics often involves aggregations, filtering, and comparisons across large event datasets.
Query performance matters as much as ingestion speed.
High concurrency
Operational dashboards and applications may generate many simultaneous queries.
The platform should support expected user and application workloads.
Scalable storage
Event data can grow rapidly.
Organizations need to understand how the platform handles retention, partitioning, compression, and historical queries.
Flexible data modeling
Events may contain changing fields or semi-structured information.
The platform should support the required schema evolution and transformation patterns.
Reliability and recovery
Production systems must handle failures without silently losing important information.
Review replication, recovery, retry behavior, and data durability.
Security
Real-time events may contain sensitive business or customer information.
Evaluate authentication, authorization, encryption, auditing, and retention controls.
Operational monitoring
Teams need visibility into ingestion delays, query performance, resource usage, and failed operations.
Real-time Analytics Platforms Worth Evaluating
Several technologies address real-time analytics through different architectural approaches.
| Platform | Primary evaluation angle |
|---|---|
| Apache Pinot | Low-latency analytical queries on event data |
| Apache Druid | Real-time ingestion and analytical aggregation |
| ClickHouse | High-performance column-oriented analytics |
| Rockset | Managed real-time search and analytics architecture |
| Tinybird | Developer-oriented real-time analytical APIs |
| StarTree | Managed analytics built around Apache Pinot |
| Azure Data Explorer | Analytics for logs, telemetry, and event data |
| Materialize | Incrementally maintained SQL results over changing data |
Product availability, packaging, and deployment options can change. In particular, Rockset’s original standalone cloud service was discontinued following its acquisition by OpenAI, so it should not be treated as an independently available purchasing option without confirming a current supported offering.
Apache Pinot
Apache Pinot is an open-source distributed analytical database designed for low-latency queries.
It is relevant to applications that need to analyze large volumes of event-oriented data with frequent queries.
Typical evaluation areas include indexing, ingestion, query patterns, concurrency, and cluster operations.
Pinot can be suitable for user-facing analytics, but operating it requires appropriate engineering expertise.
Apache Druid
Apache Druid is an open-source analytical database designed for fast aggregation and filtering across large datasets.
It is relevant to operational analytics, event exploration, and time-oriented workloads.
Buyers should evaluate ingestion methods, data partitioning, retention, query performance, and operational complexity.
ClickHouse
ClickHouse is a column-oriented analytical database.
It is relevant to workloads involving large-scale analytical queries, event data, and high-performance aggregations.
Organizations should examine data modeling, ingestion architecture, indexing approaches, storage management, and deployment options.
The best configuration depends on query patterns and operational requirements.
Tinybird
Tinybird provides a developer-oriented approach to building analytical applications and APIs.
It is relevant when engineering teams want to expose analytical results through application endpoints.
Evaluation should focus on ingestion support, SQL workflows, API management, security, and usage-based operating costs.
StarTree
StarTree provides managed analytical capabilities built around Apache Pinot.
It may be relevant to organizations that want Pinot-based analytics without operating every infrastructure component independently.
Buyers should assess service responsibilities, integration support, deployment requirements, and total cost.
Azure Data Explorer
Azure Data Explorer is designed for analytical workloads involving large volumes of logs, telemetry, and event data.
It supports the Kusto Query Language.
It is relevant to organizations operating within Microsoft Azure or managing operational analytical workloads.
Evaluation should include ingestion, retention, query capabilities, permissions, and cloud costs.
Materialize
Materialize focuses on incrementally maintaining SQL query results as underlying data changes.
It can be relevant when applications need continuously updated analytical views.
Its architecture differs from traditional analytical databases.
Organizations should evaluate source integration, consistency, freshness, supported SQL patterns, and operational requirements.
How to Choose the Right Real-time Analytics Platform
The first step is defining what real time means for the business.
Establish latency requirements
Determine the maximum acceptable delay between event creation and usable analytical results.
For example, an operational dashboard may tolerate several seconds.
A time-sensitive automated control may require a much tighter limit.
Do not pay for extremely low latency when the business does not need it.
Understand query patterns
Different platforms perform differently depending on the workload.
Common queries include:
- Counts over recent time windows
- Filtering by customer or device
- Aggregations across event categories
- Historical trend analysis
- High-cardinality groupings
- Searches across recent logs
Use representative queries during evaluation.
Estimate event volume
Measure the expected number and size of events.
Consider average throughput, peak traffic, and future growth.
A platform that handles normal traffic may struggle during sudden bursts.
Examine data retention
Not every event needs to remain in the real-time system indefinitely.
Older information may be moved to a warehouse or object storage.
Retention policies affect storage costs and query performance.
Review operational complexity
Open-source systems can provide flexibility and control.
Managed services may reduce infrastructure administration.
However, managed offerings still require data modeling, security configuration, monitoring, and cost management.
Test failure recovery
Evaluate what happens when ingestion stops, a node fails, or an upstream service becomes unavailable.
Determine whether the system can recover without losing or duplicating important information.
Real-time Analytics vs. Stream Processing
Real-time analytics and stream processing are closely related, but they solve different problems.
Stream processing frameworks transform and compute over continuously arriving events.
Real-time analytical databases focus on storing and querying information with low latency.
For example, Apache Flink may calculate a rolling transaction count.
Apache Pinot or ClickHouse may serve analytical queries over the resulting information.
Some technologies combine aspects of both approaches.
The architecture should be chosen around the complete workflow rather than category labels.
Real-time Analytics vs. Traditional Data Warehouses
Traditional data warehouses are designed for analytical workloads and often support large-scale historical analysis.
Modern cloud warehouses can also provide frequent ingestion and increasingly low-latency capabilities.
However, workloads requiring very high query concurrency, continuous updates, or specialized event indexing may benefit from a dedicated real-time analytical system.
The decision should be based on measured performance and operational requirements.
Adding another database introduces synchronization, governance, and maintenance responsibilities.
Common Real-time Analytics Use Cases
E-commerce monitoring
Retailers can monitor purchases, product interactions, and conversion patterns during active campaigns.
Financial transaction analysis
Financial organizations may analyze transaction activity to identify unusual patterns.
Additional detection logic and controls are required for reliable fraud prevention.
Application telemetry
Engineering teams can investigate application behavior using recently generated logs and events.
Manufacturing operations
Factories may analyze equipment measurements to identify abnormal operating conditions.
Logistics
Delivery and transportation companies can monitor shipment events and operational status.
Customer-facing analytics
Software providers may embed analytical dashboards into applications so customers can explore recent activity.
Implementing Real-time Analytics Successfully
Step 1: Select one time-sensitive workflow
Choose a problem where faster information creates measurable value.
Step 2: Define freshness and query targets
Document acceptable ingestion delay, query response time, and availability requirements.
Step 3: Design event schemas
Establish consistent identifiers, timestamps, and event definitions.
Step 4: Build a representative pipeline
Connect a real event source to the proposed analytical system.
Step 5: Test realistic workloads
Measure performance under expected and peak traffic.
Step 6: Validate correctness
Check that aggregates and event counts match trusted source records.
Step 7: Establish monitoring
Track ingestion lag, query latency, failed operations, and resource consumption.
Step 8: Evaluate total cost
Include computing, storage, data transfer, operational staffing, and supporting services.
Common Real-time Analytics Mistakes
One mistake is treating every reporting requirement as a real-time problem.
Continuous infrastructure may create unnecessary cost when daily updates are sufficient.
Another mistake is focusing only on ingestion speed.
A platform that receives events quickly but cannot answer queries efficiently may fail the intended use case.
Organizations also overlook late-arriving and duplicate events.
These can distort analytical results if the processing logic does not handle them correctly.
Finally, teams sometimes add multiple specialized systems before confirming that their existing warehouse cannot meet the requirement.
This increases architectural complexity without guaranteed business value.
Frequently Asked Questions
What is a real-time analytics platform?
It is a system that makes recently generated data available for low-latency analysis and querying.
Does real-time analytics mean zero delay?
No. Every system has processing and communication delays. The acceptable delay depends on the business application.
Is Apache Kafka a real-time analytics database?
No. Kafka is primarily an event streaming platform. It can deliver events to analytical systems but does not replace a dedicated analytical database.
Which platform is best for large event datasets?
The answer depends on query patterns, ingestion requirements, concurrency, retention, and operational capabilities. Apache Pinot, Apache Druid, and ClickHouse are relevant technologies to evaluate.
Can real-time analytics replace batch processing?
Not always. Many organizations use real-time analytics for operational needs and batch processing for periodic reporting and large historical workloads.
Final Thoughts
Real-time analytics platforms help organizations turn rapidly changing information into timely insights.
Their value comes from delivering the right information within the time required by the business.
The strongest implementation balances freshness, query performance, correctness, reliability, and cost.
Begin with a clearly defined use case, test realistic workloads, and avoid introducing specialized infrastructure without measurable benefits.
Real-time analytics succeeds when faster information leads to better operational decisions—not merely when data moves more quickly.